The price line is between a strong support and a strong resistance
While investors are focusing on Brexit deal and its impact on major pairs, EUR bulls do not seem strong enough to push EURUSD upward. There is not much happening in the US market either. On the price chart, price line has increased significantly and after a correction phase, the price right now is between two very important levels that do not look to be easily broken or penetrated.
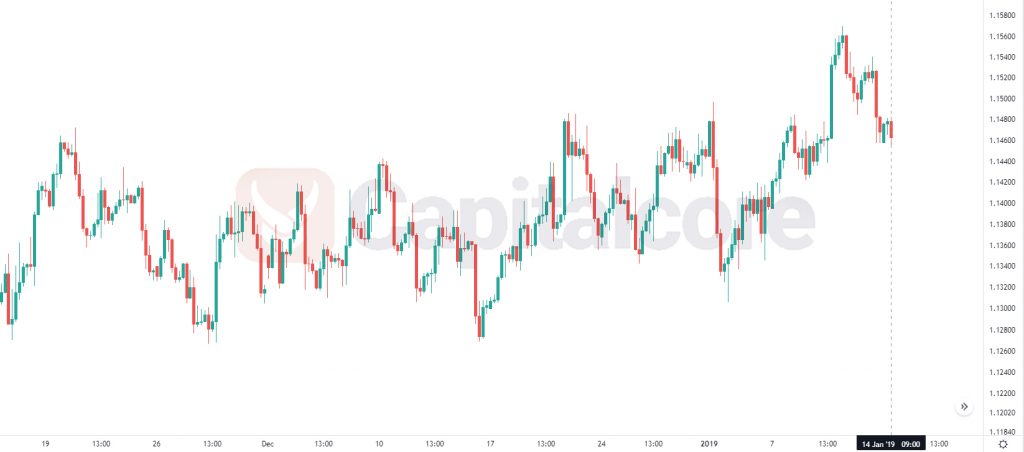
Chart Notes:
• Chart time-zone is UTC (+03:00)
• Candles’ time-frame is 4h.
The support rests at 1.14530 with resistance at 1.14920 which the weekly pivot point at 1.14790 is located in between the lines. The EMA of 10 is moving with bearish bias in the descendant channel and it is above the EMA of 200 and the EMA of 100. The RSI is moving on the 50 level and the Stochastic is moving in low ranges. The MACD line is below the signal line in the negative territory. The ADX is showing weak sell signal.
The support level breakthrough may pull the price down towards 61.8 level of Fibonacci at 1.140, otherwise, EURUSD will be fluctuating within the support and resistance lines.
• DISCLAIMER: Please note that the above analysis is not an investment suggestion by “Capitalcore Ltd”. This post has been published only for educational purposes.