- July 14, 2020
- Category: Market News
Ascending wave is limited
EURUSD did not move much yesterday due to lack of economic reports however the reports on daily number of Covid-19 in the US is more influential than economic reports. On the chart the price line has formed an ascending channel and after several reactions to the top of the channel the price is once more touching the top line of the channel.
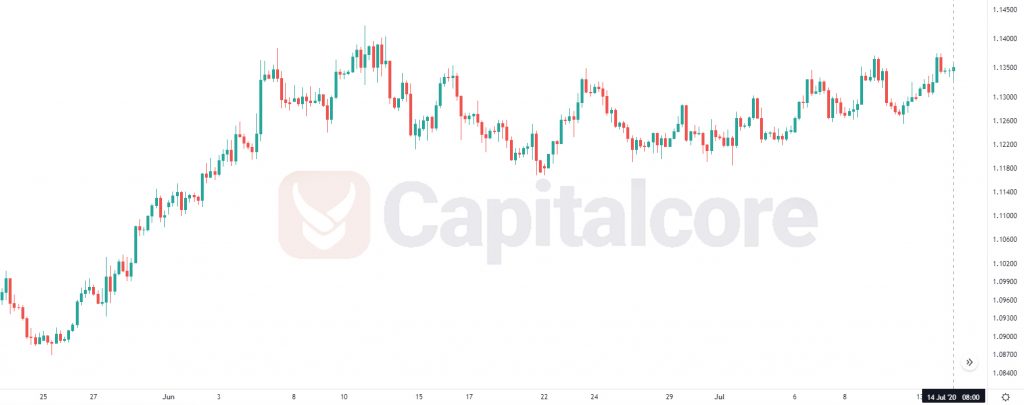
Chart Notes:
• Chart time-zone is UTC (+03:00)
• Candles’ time-frame is 4h.
The support rests at 1.13300 with resistance at 1.13550 which both lines are above the weekly pivot point at 1.13040. The EMA of 10 is moving with bullish bias in the ascendant channel and it is above the EMA of 200 and the EMA of 100. The RSI is moving above level 50, the Stochastic is moving in high ranges and the MACD line is above the signal line in the positive territory. The ADX is showing buy signal.
The bullish trend is limited to the upper Bollinger band at 1.13750.
• DISCLAIMER: Please note that the above analysis is not an investment suggestion by “Capitalcore Ltd”. This post has been published only for educational purposes.