- Posted By: james w
- Category: Market News
EURUSD Liquidity Risks on Low Activity Day
The EURUSD pair, often referred to as the “Fiber,” is one of the most actively traded currency pairs in the forex market. This pair represents the value of the euro, the official currency of the Eurozone, relative to the US dollar, the primary global reserve currency. Today, trading may see lower liquidity and unpredictable volatility due to bank holidays in both France and the United States, marking Armistice and Veterans Day. While low liquidity days can sometimes reduce price movement, they also amplify the role of speculators, which could lead to sharp, irregular price shifts. Additionally, the upcoming Bundesbank bond auction data may provide insight into investor confidence within the Eurozone, potentially impacting EUR USD sentiment. Traders should remain cautious and monitor any unexpected volatility, especially given the variable effects of these news events.

Chart Notes:
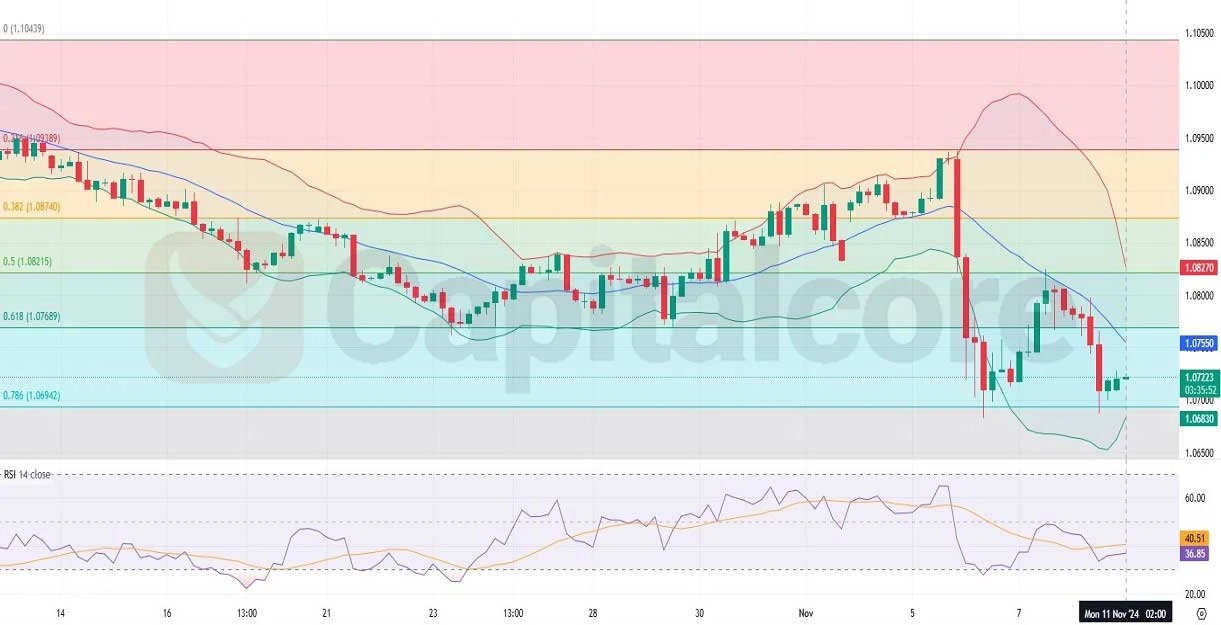
• Chart time-zone is UTC (+02:00)
• Candles’ time-frame is 4h.
Looking at the EURUSD H4 chart provided, the price has been trending downward, consistently staying in the lower half of the Bollinger Bands. However, recent candles show a potential bullish reversal, with the last three candles moving upwards, suggesting buyers might be stepping in. The Bollinger Bands have expanded significantly, indicating high volatility. Additionally, the Relative Strength Index (RSI) is near oversold territory, which could hint at further upward correction if the momentum continues. From a Fibonacci retracement perspective, the price is currently between the 0.786 and 0.618 levels, suggesting a potential support area that may hold if buyers continue to show interest.
•DISCLAIMER: Please note that the above analysis is not an investment suggestion by “Capitalcore LLC”. This post has been published only for educational purposes.