Is this a fake break-out or a trend reversal signal?
After a long ascending trend EUR/USD price broke out of its ascending channel and today retested the bottom of the channel once more. since the last descending wave could break a strong static support level along with the bottom of the channel, a good position to open a trade is formed. at the moment the price is at about 1.195 – 1.1965, where has acted as support and resistance level for several times before, but this time it was broken and a pool back is being made to it. so here we have listed three most possible outcomes in up coming days.
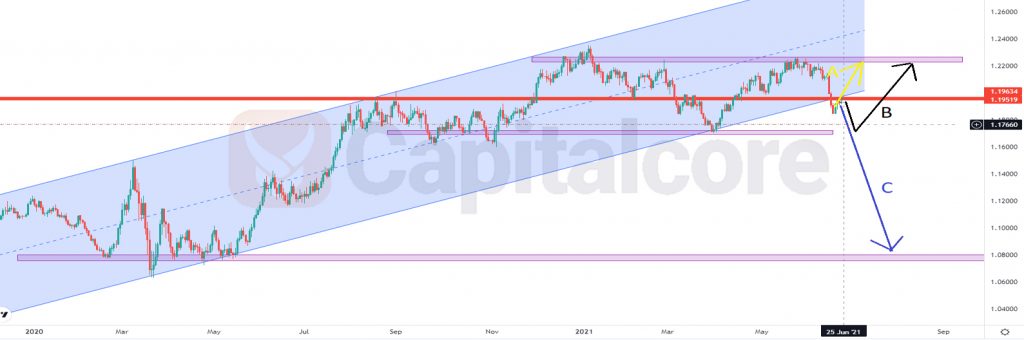
Chart Notes:
• Chart time-zone is UTC (+03:00)
• Candles’ time-frame is daily.
So based on what we can see on the chart, there are three possible outcomes for EUR/USD chart in the next few days:
• A: the resistance level at about 1.195 – 1.196 will not be able to hold the price; in this case after getting bullish signals from 1 or 4 hour candles, we can be waiting for a bullish move to the next strong resistance level which is at about 1.223 – 1.226 .
• B: the resistance level will push the price down to the next support level at 1.172 – 1.169 and after that the next bullish trend will get the price to 1.222 – 1.235 which is the strongest resistance around.
• C: the price starts a strong descending trend and will break out of the support level at 1.172 – 1.169 after breaking out of the current price, in this case the ascending trend will fall sufficiently since the next strong support level is at about 1.08.
• DISCLAIMER: Please note that the above analysis is not an investment suggestion by “Capitalcore Ltd”. This post has been published only for educational purposes.