- January 27, 2023
- Category: Market News
A descending wave seems to be close
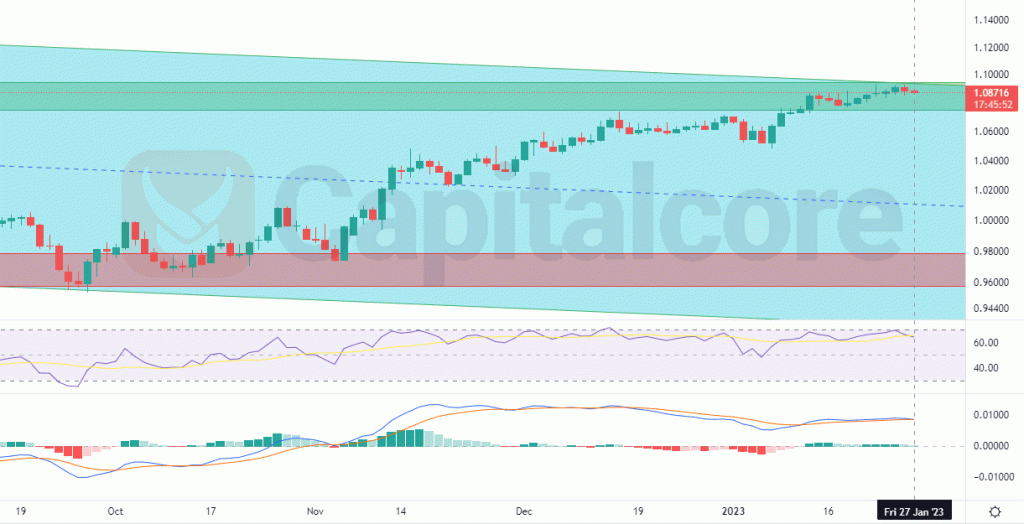
The EURUSD market equilibrium has recently relocated within a narrow trading range between about 1.18200 and 1.23500. The price line has responded several times to these two levels, and it is now going to reach the potential barrier, increasing the possibility of a descending wave.

Chart Notes:
• Chart time-zone is UTC (+03:00)
• Candles’ time-frame is daily.
The price line on the EURUSD price chart has recently moved within a narrow trading range of approximately 1.18200 and 1.23500. The price line has responded to these two levels several times, and it is now approaching the resistance level at 1.23500. The candle patterns, as well as some indicators, point to an impending bearish phase. Although the RSI has already issued negative divergence signals, the MACD is still in a bullish phase. Sellers should keep a close eye on the chart for any potential bearish triggers, at which point they can enter short positions targeting the support zones at 1.20000 and 1.19130.
• DISCLAIMER: Please note that the above analysis is not an investment suggestion by “Capitalcore Ltd”. This post has been published only for educational purposes.