Analyzing the Momentum in EUR/USD
EUR/USD, commonly referred to as “Fiber” in the forex trading community, is one of the most actively traded currency pairs in the world. It represents the exchange rate between the Euro and the U.S. Dollar. This pair is known for its liquidity and volatility, which attracts a large number of analysts, traders and investors. The pair’s movements are influenced by various economic indicators and geopolitical events, making it a barometer for gauging the health of the global economy. Traders often look at technical indicators, current price actions and candlestick patterns to make informed decisions about weather going short or long on EURUSD pair.
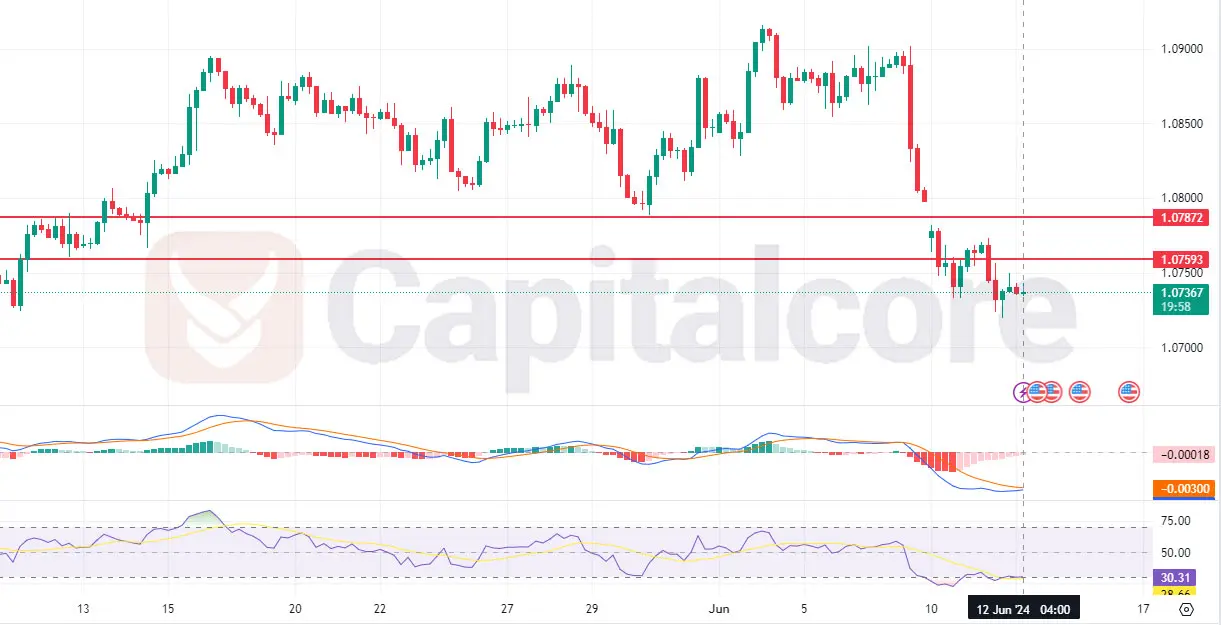
Chart Notes:
• Chart time-zone is UTC (+03:00)
• Candles’ time-frame is 4h.
In the provided H4 chart of EUR/USD, the price recently broke below an important support zone, indicating a shift in the pair current trend. The candlestick patterns are showing clear bearish momentum, suggesting that sellers are currently in control of this pair. This is further confirmed by the Relative Strength Index (RSI) and the Moving Average Convergence Divergence (MACD) indicators, both of which are showing bearish on-going trends. The RSI is below the 30 level, which typically indicates that the pair is in an oversold condition. However, this doesn’t necessarily mean an immediate reversal; instead, it may suggest that bearish momentum could continue. Similarly, the MACD histogram is displaying negative values, reinforcing the bearish outlook. Traders should watch for further price action around current levels and key support zones for potential trading opportunities on this major currency pair.
• DISCLAIMER: Please note that the above analysis is not an investment suggestion by “Capitalcore Ltd”. This post has been published only for educational purposes.