Aussie Dollar Bearish Potential
The AUD/USD currency pair, commonly known as the “Aussie,” is currently facing a significant resistance level, as evidenced by the provided chart. The price line has tested this strong resistance multiple times but has struggled to break above it, indicating a potential bearish trend. Notably, the recent market low was lower than the previous lows, and the last high failed to surpass the prior highs. These patterns suggest that the pair may continue to struggle in overcoming the resistance in the near term.
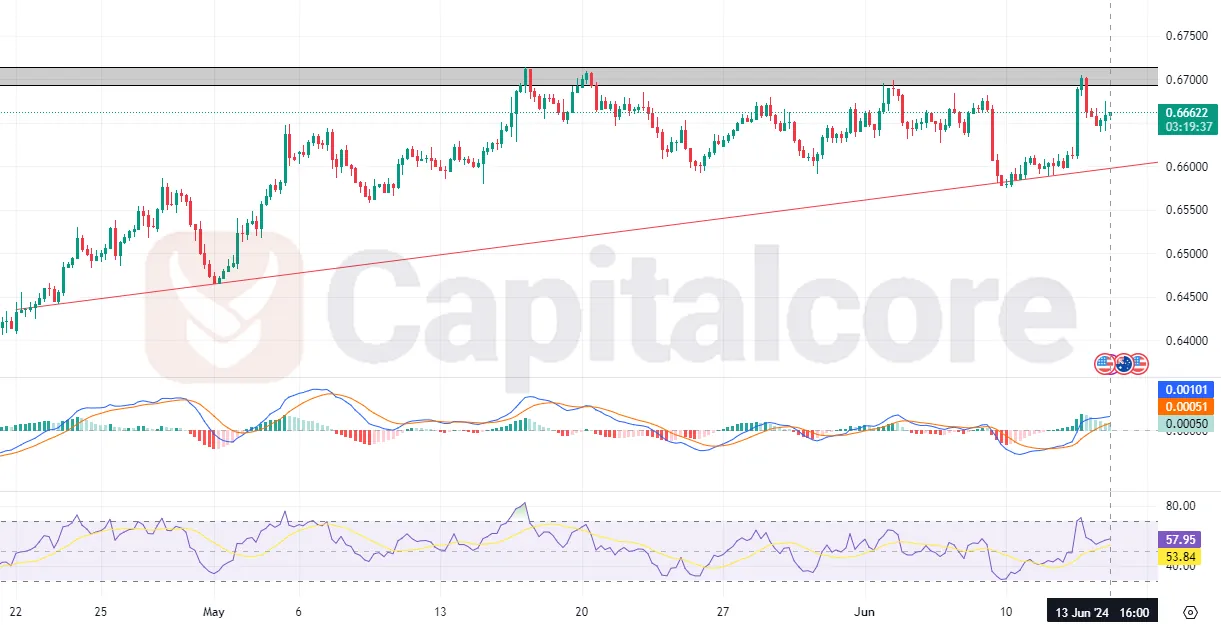
Chart Notes:
• Chart time-zone is UTC (+03:00)
• Candles’ time-frame is 4h.
Technical indicators such as the MACD and RSI also support the bearish outlook for the AUD/USD. The MACD shows a bearish crossover, indicating potential downward momentum, while the RSI is moving towards the lower end, further signaling bearish potential. Traders should be cautious as these indicators, combined with the price action analysis, point towards a possible decline in the Aussie against the USD. This analysis is crucial for those interested in forex trading, specifically for those searching for detailed AUD/USD analysis and market trends.
• DISCLAIMER: Please note that the above analysis is not an investment suggestion by “Capitalcore Ltd”. This post has been published only for educational purposes.