Bullish Momentum on the Rise
The USD/CAD pair, often referred to as the “Loonie,” is a popular forex pair that represents the exchange rate between the U.S. dollar (USD) and the Canadian dollar (CAD). In recent trading sessions, the USD/CAD pair has shown significant bullish momentum, with the price line breaking above the Ichimoku cloud. This technical development suggests a potential shift in market sentiment, favoring a bullish trend. Traders looking for reliable forex trading signals and USD/CAD technical analysis should closely monitor this pair as it approaches a critical resistance level.
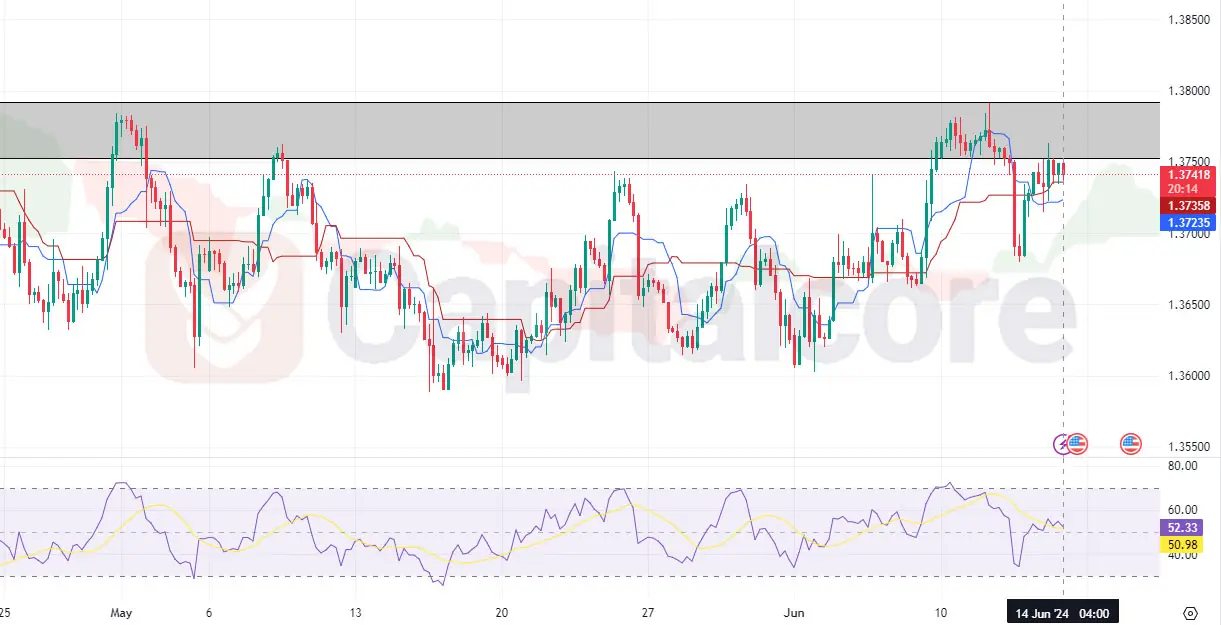
Chart Notes:
• Chart time-zone is UTC (+03:00)
• Candles’ time-frame is 4h.
If the USD/CAD price successfully breaks above the resistance level highlighted in the chart, it would indicate a strong bullish takeover, further solidifying the uptrend. This breakout could lead to increased buying pressure, providing lucrative opportunities for traders. Utilizing expert trading signals and in-depth USD/CAD technical analysis can help traders capitalize on these potential market movements. Staying informed and leveraging accurate trading signals are essential for navigating the forex market effectively, especially when trading the dynamic USD/CAD pair.
• DISCLAIMER: Please note that the above analysis is not an investment suggestion by “Capitalcore Ltd”. This post has been published only for educational purposes.