USDJPY: Technical Insights and Fundamental Drivers
The USD/JPY currency pair, often referred to by traders as the “Gopher,” is a significant forex pair representing the exchange rate between the US dollar and the Japanese yen. This pair is heavily influenced by the economic policies and conditions in both the United States and Japan, making it a focal point for forex traders aiming to exploit macroeconomic trends and news releases.
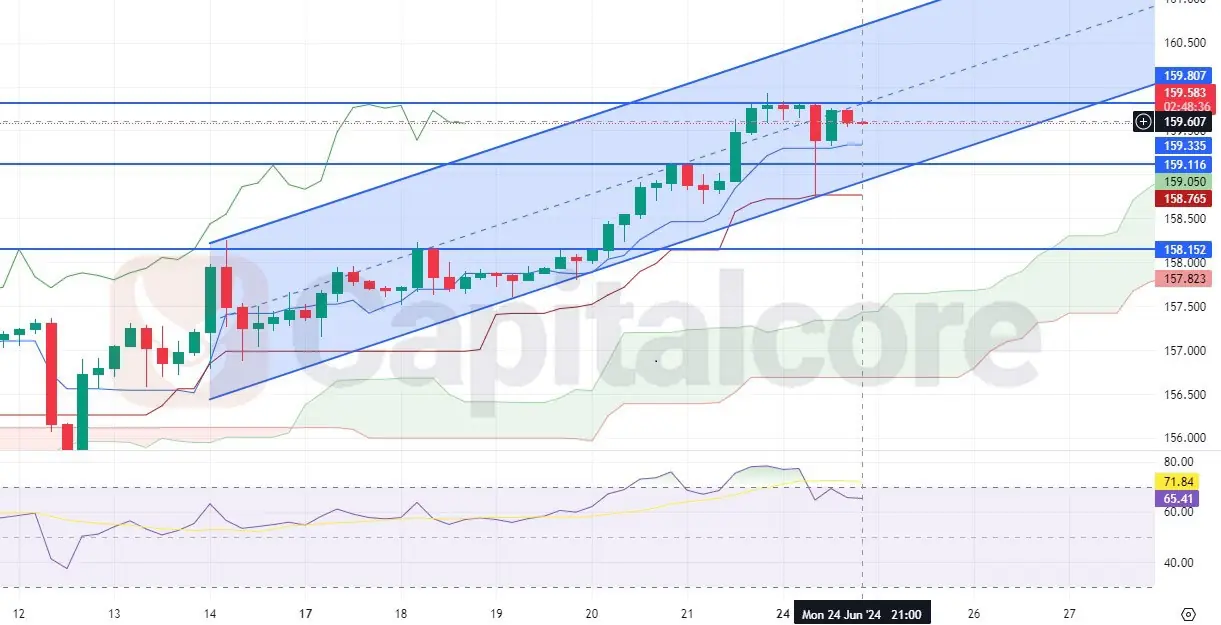
Chart Notes:
• Chart time-zone is UTC (+03:00)
• Candles’ time-frame is 4h.
Based on the USD/JPY H4 chart, the pair is currently trading within a rising channel, indicating a bullish trend on this pair. The price action of USD/JPY shows that the pair has recently tested the upper boundary of the channel around 159.60, facing resistance and showing signs of consolidation. Key support levels to watch include 159.33 and 159.11, which coincide with the lower boundary of the channel and the previous resistance turned support. The RSI indicator is currently in the overbought zone, suggesting a potential for a minor pullback before any further upward movement.
In the context of the USD/JPY news forecast today, the Corporate Services Price Index (CSPI) and the Consumer Price Index (CPI) from the Bank of Japan play crucial roles. The higher-than-expected CSPI indicates rising costs for corporations, potentially leading to increased inflationary pressures. On the other hand, the upcoming Federal Reserve Governor Michelle Bowman’s speech could provide insights into US monetary policy, potentially impacting the USD/JPY pair. Traders should closely monitor these fundamental indicators alongside technical levels to make informed trading decisions.
• DISCLAIMER: Please note that the above analysis is not an investment suggestion by “Capitalcore Ltd”. This post has been published only for educational purposes.