Trend reversal is about to take place
After a sharp descend, EUR/CAD reached a strong weakly support . As expected, price reacted to the support level and could finally break out of the descending trendline. right now a strong support has formed below the price line. The overall look of the chart is bullish.
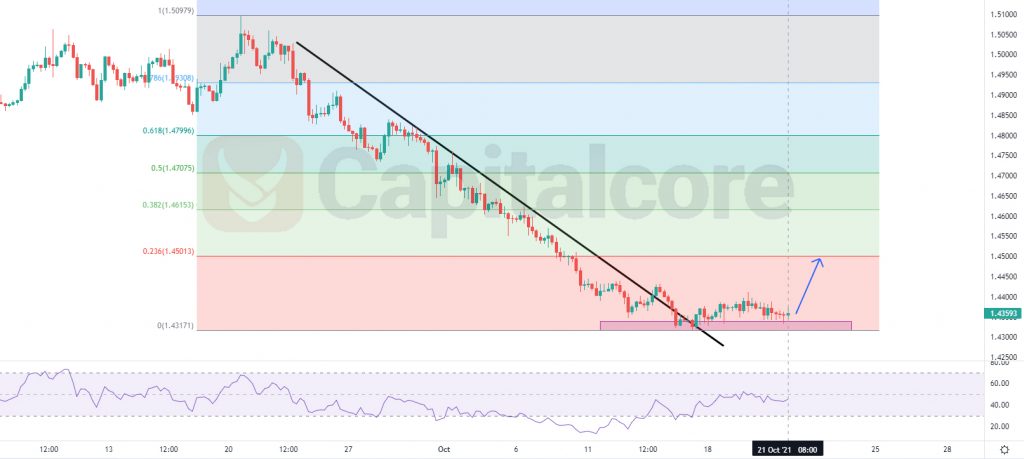
Chart Notes:
• Chart time-zone is UTC (+03:00)
• Candles’ time-frame is 4h.
The weekly support level lays at 1.432-1.435. RSI indicator is showing 48. In case the support level does not get broken, bulls can be ready for a strong ascending wave. buyers can target 1.45 as their first TP, as this is the 0.236 level of the Fibonacci retracement and also the price line has made a few reaction to this level. The next TP for bulls can be 1.457, which is 0.382 of the Fibonacci retracement. On the other hand, in case the price breaks below the current support level, The ascend could continue to 1.426. The next target for sellers can be set on 1.42.
• DISCLAIMER: Please note that the above analysis is not an investment suggestion by “Capitalcore Ltd”. This post has been published only for educational purposes.