EUR/USD price, broke out of the descending wave
EUR/USD price started a descending wave on 26th of May 2021 and the price fall up to 8.75% until 24th of November 2021. From there, a sideway market started and led the price line into the dynamic resistance that formed during the descending wave. On January 22nd, the price line could finally break above the resistance and now traders can be waiting for a bullish wave.
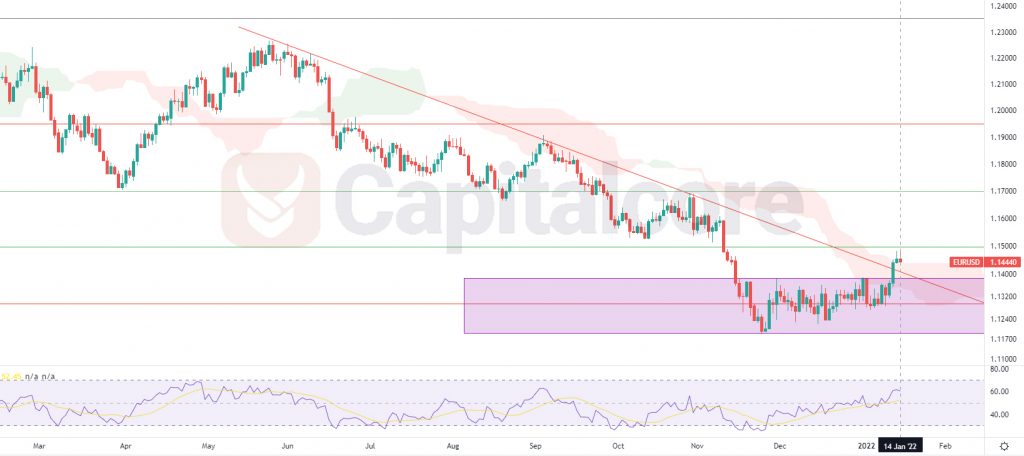
Chart Notes:
• Chart time-zone is UTC (+03:00)
• Candles’ time-frame is daily.
EUR/USD price, at the moment, is on 1.1444. The diagonal red line on the chart, shows the dynamic resistance that has just been broken. RSI is almost showing 60 and the price is just above the flat Icimoku cloud. The green flat line above the price, represents level 0.5 of the Fibonacci retracement. The purple area shows the buying zone. Buyers can be waiting for the price line to enter buying zone and then they can enter the market. The possible targets for the ascending wave could be considered on 1.17 and 1.195 . Kindly, consider that in case the price breaks below 1.116, The possibility for ascending would highly decrease. Traders can decrease the average buying price by buying at different price levels, within the purple area.
• DISCLAIMER: Please note that the above analysis is not an investment suggestion by “Capitalcore Ltd”. This post has been published only for educational purposes.