Bullish trend is still valid
EUR has been empowered by the ECB. The election is not over yet and the market is still volatile. On the price chart, the price is forming a bullish channel after forming a double low. The overall look of the chart is bullish and an ascending wave is expected.
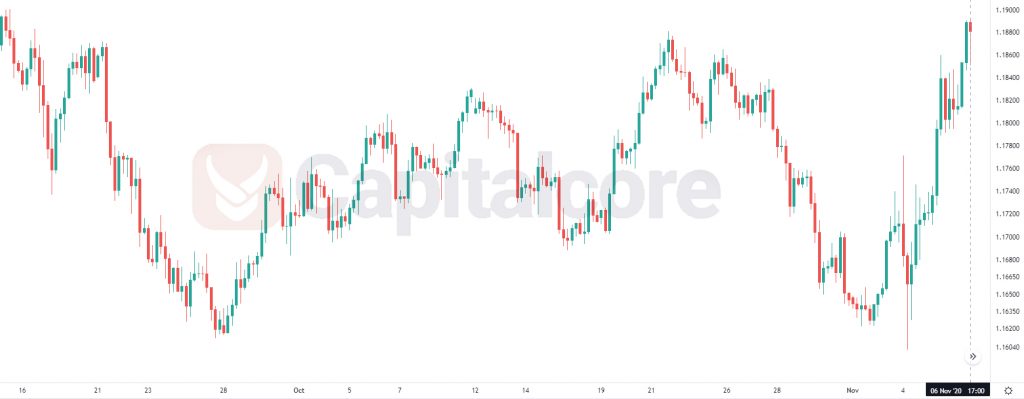
Chart Notes:
• Chart time-zone is UTC (+03:00)
• Candles’ time-frame is 4h.
The support rests at 1.16950 with resistance at 1.17520 which the weekly pivot point at 1.17160 is located in between the lines. The EMA of 10 is moving with bullish bias in the ascendant channel and it is below the EMA of 200 and the EMA of 100. The RSI is moving in oversold area, the Stochastic is showing upward momentum and the MACD line is above the signal line in the positive territory. The ADX is showing buy clear signals.
EURUSD is trying to hit 1.17800.
• DISCLAIMER: Please note that the above analysis is not an investment suggestion by “Capitalcore Ltd”. This post has been published only for educational purposes.