The support level looks too fragile to hold the price
USD has been weakened due to US ISM manufacturing activity index and now traders will be watching the Eurozone’s data along with the US Non Farm Payrolls closely. The price is moving in a ascending channel and right now is in the middle of the channel. the next move would be an ascend to the top of the channel or a descend to the base of the channel.
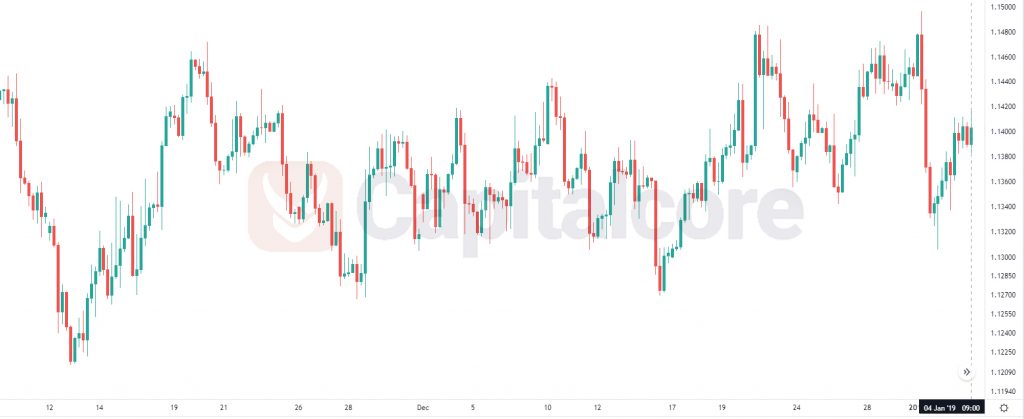
Chart Notes:
• Chart time-zone is UTC (+03:00)
• Candles’ time-frame is 4h.
The support rests at 1.13740 with resistance at 1.14160 which both lines are below the weekly pivot point at 1.14200. The EMA of 10 is moving with bullish bias in the ascendant channel and it is below the EMA of 200 and the EMA of 100. The RSI is moving on the 50 level and the Stochastic is moving in high ranges. The MACD line is above the signal line in the positive territory. The ADX is not showing any clear signals.
The price is fluctuating on the middle Bollinger band, not indicating the next move. The resistance level breakout may push the price up towards 1.1456, otherwise, EURUSD may drop to 1.1353.
• DISCLAIMER: Please note that the above analysis is not an investment suggestion by “Capitalcore Ltd”. This post has been published only for educational purposes.