EUR/USD Price Dynamics: Interpreting Bollinger Volatility
The EUR/USD pair, a focal point for global currency markets, reflects the dynamic economic interplay between the Eurozone and the United States. Its fluctuations offer insights into the broader economic narratives shaping international finance. This analysis delves into the recent technical indicators to discern the potential trajectory of the pair.
0
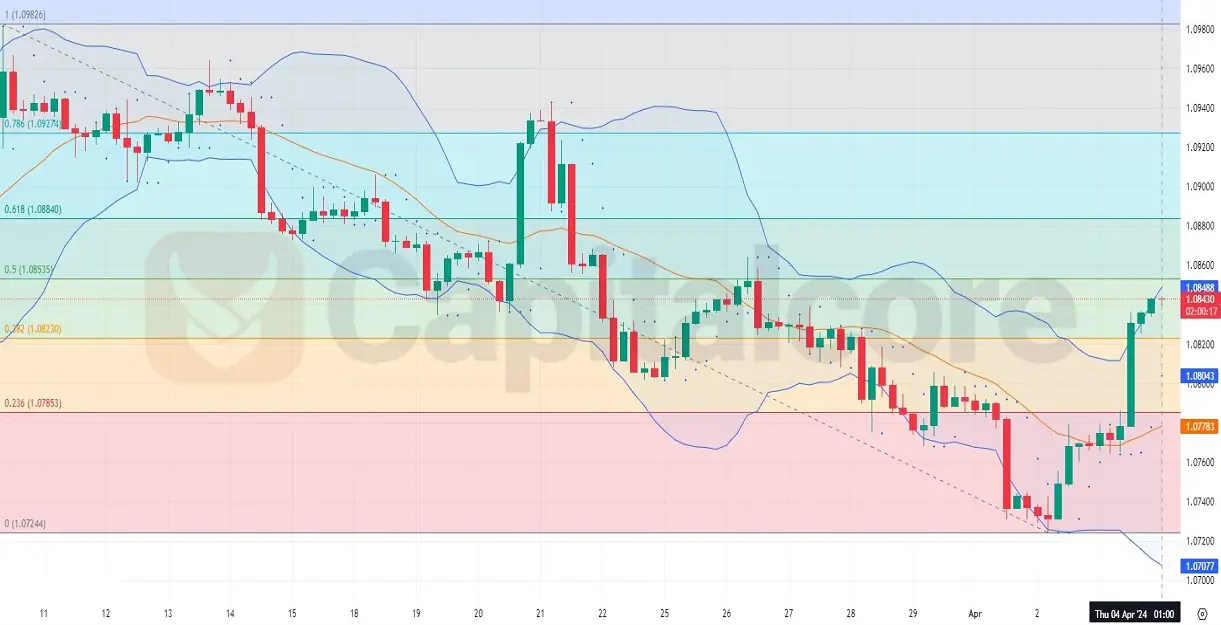
Chart Notes:
• Chart time-zone is UTC (+03:00)
• Candles’ time-frame is 4h.
The EUR/USD H4 chart reveals a robust upward movement, breaking away from recent consolidation phases. The Parabolic SAR, positioned below the price, signals this bullish trend as it underscores a potential continuation of upward momentum. The Bollinger Bands have widened significantly following the price spike, indicating heightened market volatility and potentially more room for the trend to develop before reaching overextended levels.
A closer look at the Fibonacci retracement levels, drawn from the swing high at 1.0928 to the low at 1.0774, shows the price reacting off the 23.6% level and now testing the 38.2% retracement at 1.0848. Should the bullish trend persist, the 50% retracement at 1.0853 may soon come into play as a resistance point. The price residing above the middle Bollinger Band further supports the bullish sentiment.
• DISCLAIMER: Please note that the above analysis is not an investment suggestion by “Capitalcore Ltd”. This post has been published only for educational purposes.