The price line is on an important support level
EUR/USD started a descending wave on 25th of May and experienced a dramatic change of price (almost 8.75%) and could reach out to 1.1193. The price then started a side way range and is getting ready for the next move. Currently the price line is on a very important support level.
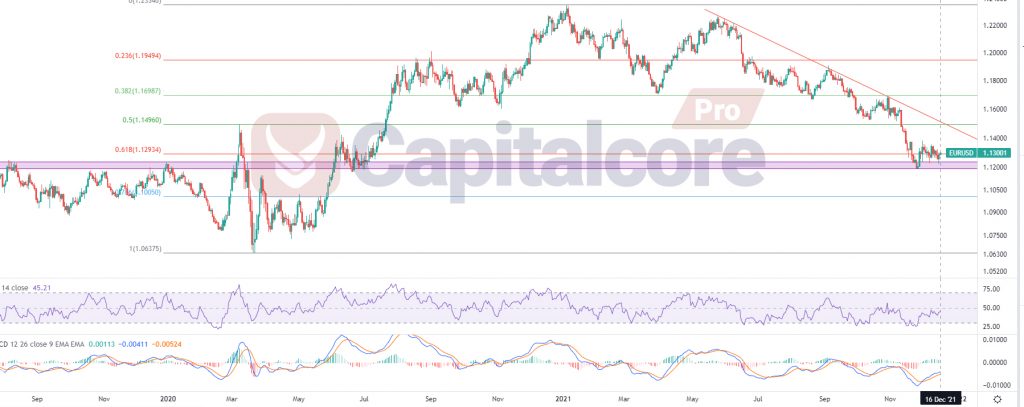
Chart Notes:
• Chart time-zone is UTC (+03:00)
• Candles’ time-frame is daily.
Currently, on the chart, the price line is on 1.13. There is a strong support level below the price line at 1.12 – 1.1242 which almost equals to level 0.618 of the Fibonacci retracement. There is a dynamic resistance above the price, colored in red. RSI indicator is below 50, almost on 46. MACD is showing a weak ascending trend formation. The overall look of the chart is bearish. Sellers can wait for the price line to break below the support level and on the retest of the area, they can be waiting for a trigger to enter the market. The possible targets for the descending wave could be considered 1.101, and in case the price could break below that area, 1.0635 can be considered to be the next possible target. Please note that breaking above the dynamic resistance will reduce the chance of descend majorly.
• DISCLAIMER: Please note that the above analysis is not an investment suggestion by “Capitalcore Ltd”. This post has been published only for educational purposes.