Shifting Trends: EUR/USD’s Bullish Signal Emerges
The EUR/USD chart depicted shows a trading pattern within a certain timeframe. We can observe a downtrend initially, as indicated by the overall movement of the price below the Ichimoku Cloud, which is shaded in the chart. The Ichimoku Cloud, or Kumo, acts as a dynamic support and resistance indicator, and being below the cloud typically suggests bearish sentiment.
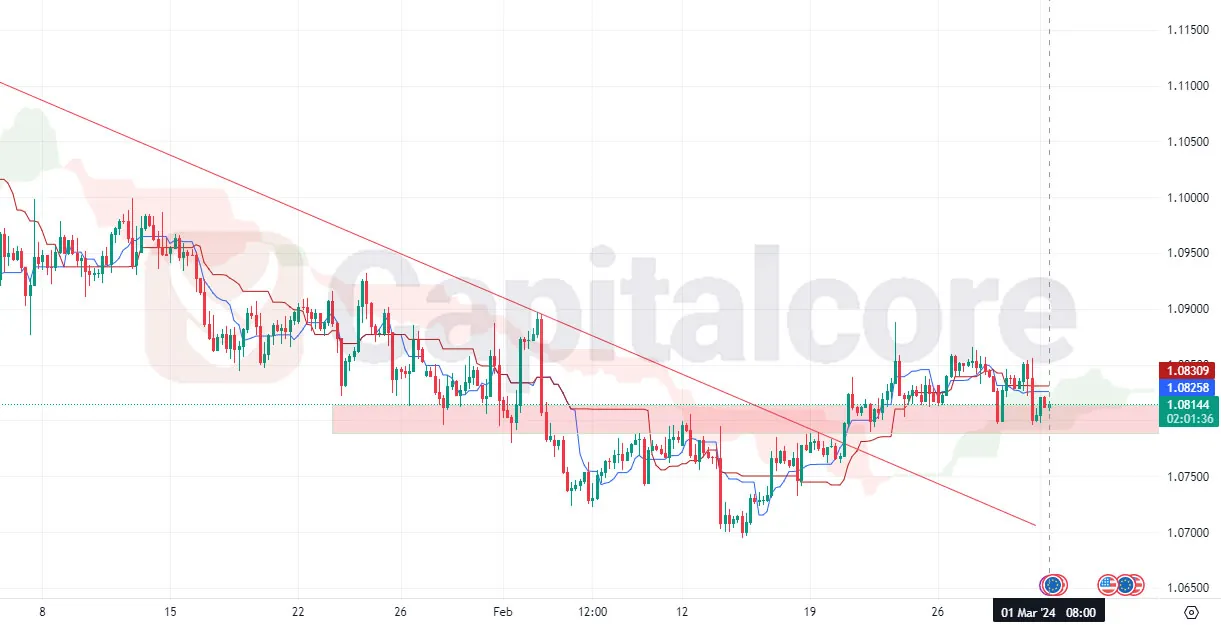
Chart Notes:
• Chart time-zone is UTC (+03:00)
• Candles’ time-frame is 4h.
The price action below the cloud is characterized by a series of lower highs and lower lows, which is indicative of a bearish trend. However, as the chart progresses, there is a noticeable shift in momentum. The price breaks through the Ichimoku Cloud, moving from beneath to above it. This breakout above the cloud could be interpreted as a bullish signal, suggesting a potential trend reversal or at least a pause in the previous downtrend.
Additionally, at the right edge of the chart, the price seems to be consolidating above the cloud, with the upper and lower boundaries of the cloud acting as immediate support and resistance levels. This consolidation above the cloud might indicate uncertainty or a balance between buyers and sellers as the market evaluates the next direction.
The chart also shows a specific price level marked with a horizontal line, possibly indicating a significant support or resistance level that traders are watching. The oscillators or other technical indicators are not visible in this image, but if this were a live chart, traders would likely be examining indicators such as RSI (Relative Strength Index), MACD (Moving Average Convergence Divergence), and volume metrics to confirm any signals suggested by the price action and the Ichimoku Cloud setup.
In summary, the image shows a transition from a bearish to a potentially bullish trend with the price breakout above the Ichimoku Cloud, suggesting a shift in market sentiment for the EUR/USD currency pair within the depicted timeframe. As always with technical analysis, confirmation from other indicators and market news should be considered to form a comprehensive market outlook.
• DISCLAIMER: Please note that the above analysis is not an investment suggestion by “Capitalcore Ltd”. This post has been published only for educational purposes.