- Posted By: capadmin
- Category: Market News
Euro Versus Aussie Technical Outlook
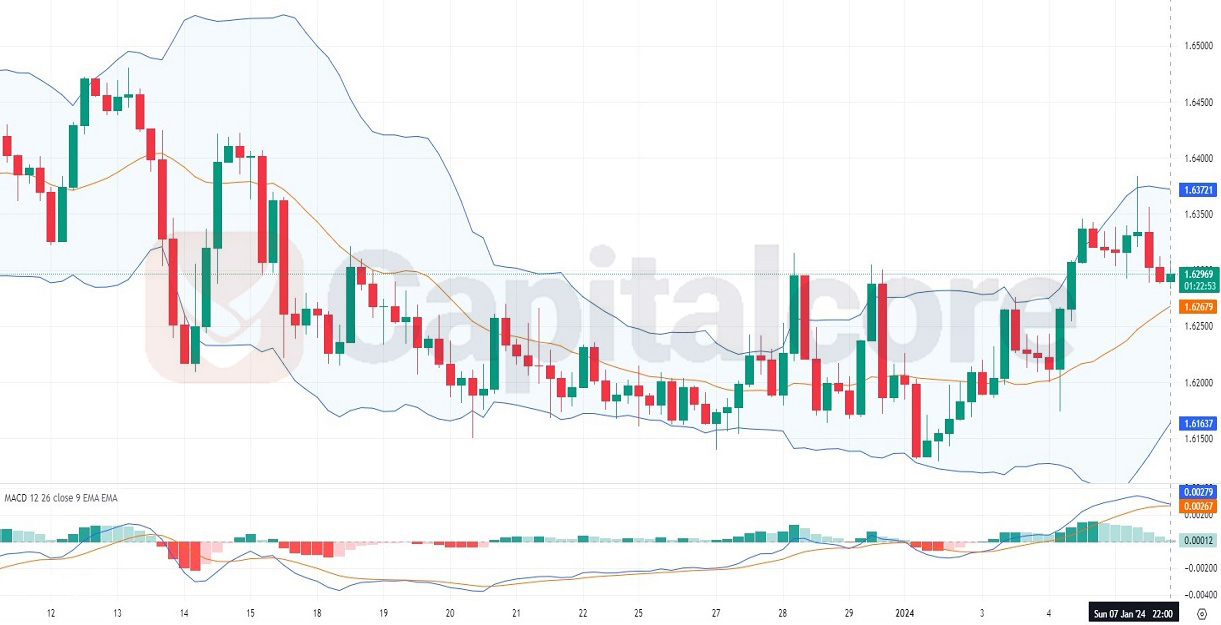
The EURAUD pair captures the value dynamics between the Euro and the Australian Dollar, offering insights into the relative economic health and interest rate differentials between the Eurozone and Australia. This technical analysis will dissect recent price movements and indicator readings to gauge potential future trends.

Chart Notes:
• Chart time-zone is UTC (+03:00)
• Candles’ time-frame is 4h.
The EUR/AUD chart shows a recent uptick in volatility, as reflected by the widening of the Bollinger Bands, with the price currently retracing from the upper band, indicating a potential cooling off from the recent peak. The MACD histogram is positive but shows a decline in momentum as the bars shorten, suggesting a possible slowdown in the bullish trend. The signal line is converging towards the MACD line, hinting at a potential bearish crossover in the near term. If this crossover occurs, it could signal a shift towards a corrective phase or a consolidation of gains. The currency pair’s recent uptrend has taken it above the middle Bollinger Band (the 20-period moving average), which now serves as a tentative support level. A sustained move below this could confirm a bearish momentum, possibly driving the prices towards the lower band.
• DISCLAIMER: Please note that the above analysis is not an investment suggestion by “Capitalcore Ltd”. This post has been published only for educational purposes.