EURCAD H4 Chart: Indecision Within Ichimoku Cloud
The EUR/CAD pair, represented on the H4 chart, offers insights into the exchange rate dynamics between the Euro and the Canadian Dollar. This time frame is particularly useful for identifying medium-term trends and potential reversal points that can impact trade decisions.
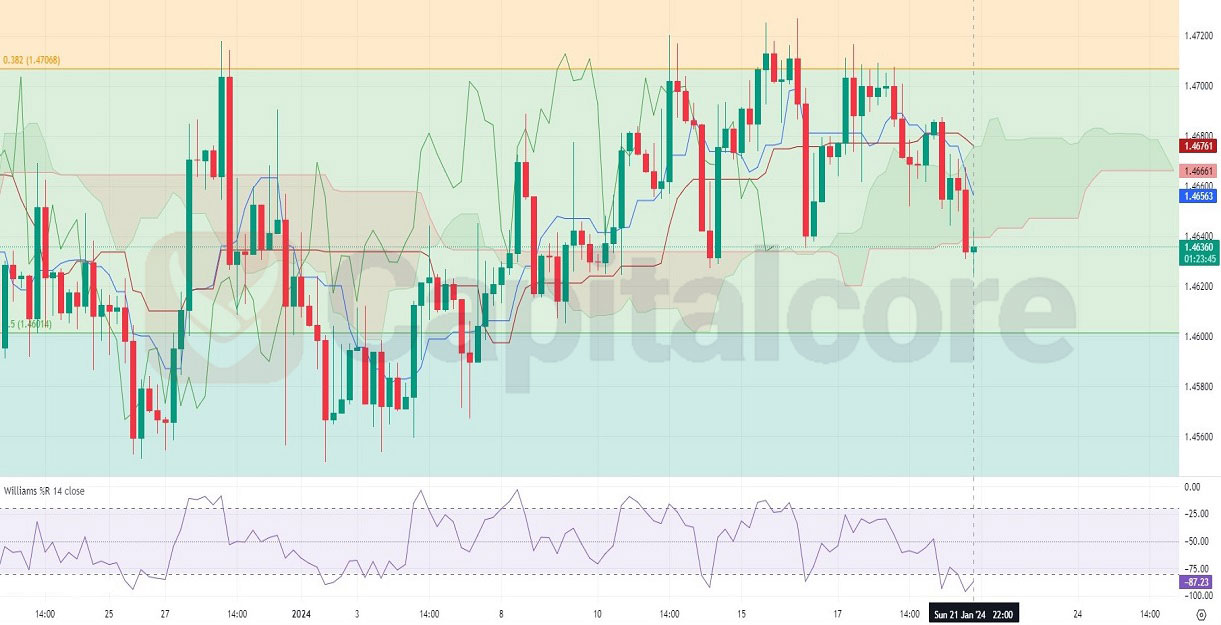
Chart Notes:
• Chart time-zone is UTC (+03:00)
• Candles’ time-frame is 4h.
On the H4 chart for EUR/CAD, the price action is currently navigating within the Ichimoku Cloud, suggesting a phase of indecision as the market consolidates. The proximity of the price to the lower boundary of the cloud could indicate potential support or an impending breakout to the downside. The Williams %R indicator is lingering near the oversold territory, signaling that the pair might be due for a corrective bounce if buying pressure enters the market. However, traders should be cautious of false signals as sustained oversold readings can also accompany strong downtrends.
Fibonacci Retracement levels show the price bouncing off the 61.8% level, suggesting it’s a significant support zone. A sustained hold above this level could prompt a move towards the 50% or 38.2% levels, acting as potential resistance. A breach below could lead to further declines towards the 78.6% level, indicating a stronger bearish trend.
• DISCLAIMER: Please note that the above analysis is not an investment suggestion by “Capitalcore Ltd”. This post has been published only for educational purposes.