>Analyzing Euro’s Bearish Momentum
The EUR/GBP forex pair has recently entered a bearish phase on the H4 timeframe, indicating a potential shift in market sentiment. The price action shows a clear break below a triangle pattern, typically signaling the start of a new trend. The Moving Average Convergence Divergence (MACD) histogram is in negative territory, and the MACD line is below the signal line, suggesting increased bearish momentum. Additionally, the Relative Strength Index (RSI) is slightly below the 50 level, aligning with the downward outlook.
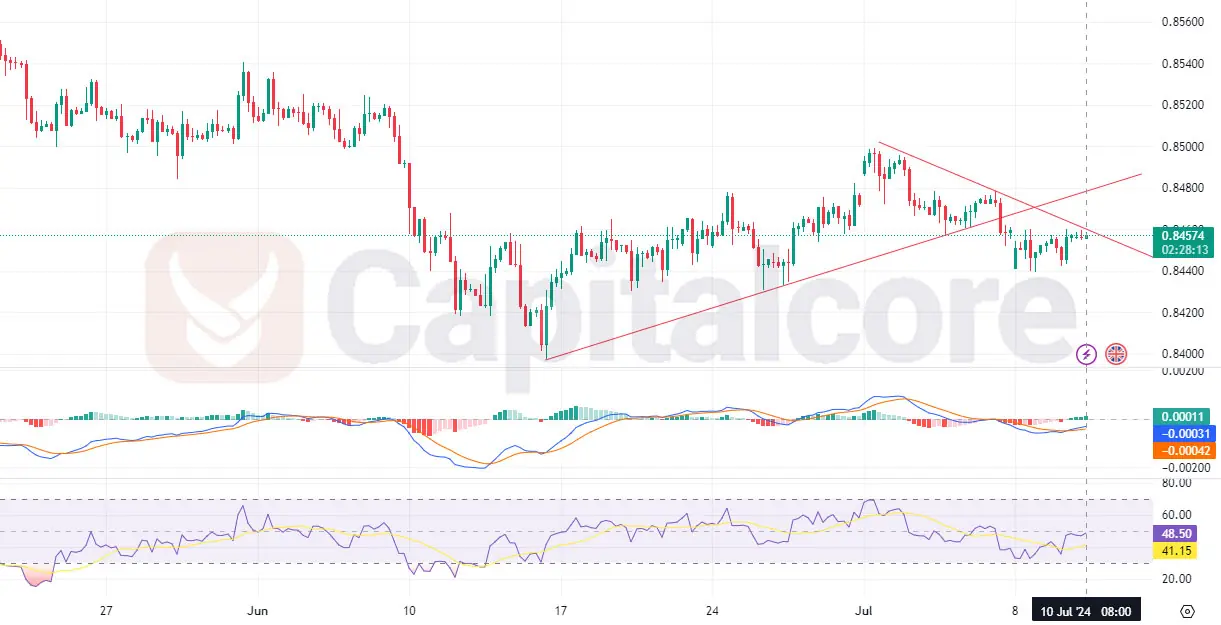
Chart Notes:
• Chart time-zone is UTC (+03:00)
• Candles’ time-frame is 4h.
Given the current technical setup, EUR/GBP is expected to continue its decline towards the next support levels. The immediate support is around the 0.8420 mark, coinciding with recent price lows. A breach below this level could lead to further downside towards 0.8370, a historically significant support zone. Traders should closely monitor these levels to gauge potential price reactions and adjust their strategies accordingly.
Upcoming economic events will play a crucial role in determining the pair’s direction. Key Eurozone indicators, such as GDP growth and inflation rates, alongside European Central Bank (ECB) policy meetings, could influence the Euro’s strength. In the UK, economic data like employment figures and Bank of England (BoE) communications will be pivotal. Strong UK economic performance or hawkish BoE signals could add further pressure on EUR/GBP, reinforcing the bearish sentiment.
• DISCLAIMER: Please note that the above analysis is not an investment suggestion by “Capitalcore Ltd”. This post has been published only for educational purposes.