Trend reversal looks to be close
EUR/JPY started forming an ascending wave on 20th of December 2021 and could ascend significantly up to almost 3.2% . The ascending wave then showed a little weakness and the trend reversal might be close. The ascending slope of the chart has decreased.
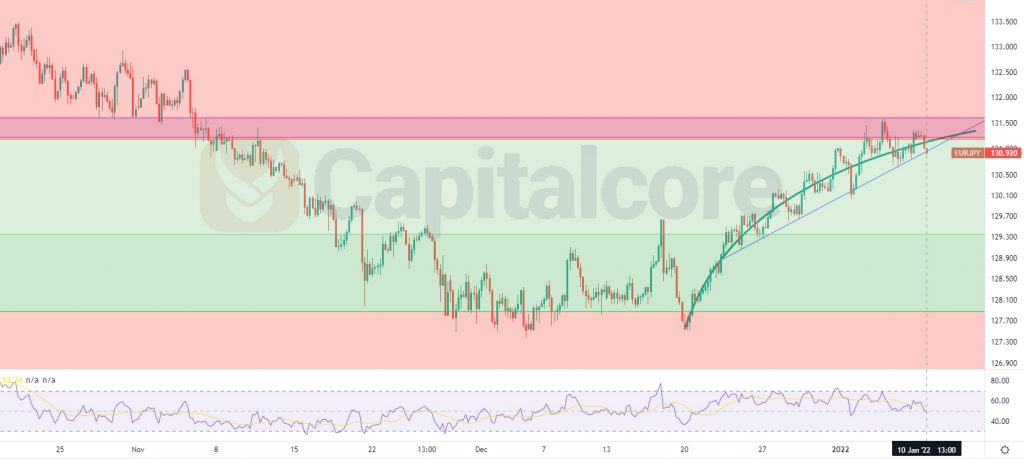
Chart Notes:
• Chart time-zone is UTC (+03:00)
• Candles’ time-frame is 4h.
The price at the moment is on 130.92, which would be smoothly below level 0.236 of the Fibonacci retracement. The ascending slope has decreased; the green curvy line of the chart shows this fact. RSI is almost on 50 and has issued several negative divergences. The price has been moving above a dynamic support, shown as a blue line below the price line and currently the price line is about the break below this area. There is a resistance level in 131.18 – 131.62, just above the price line, shown as a purple area on the chart, the area also equals to level 0.236 of the Fibonacci retracement. In case the price breaks below the blue support line, sellers can be waiting for a retest on the purple area and then can enter the market. The possible targets for the descending wave could be considered on 129.35, 128.666 and 128. Please consider that in case the price breaks above 131.84, the chance of descending wave reduces majorly.
• DISCLAIMER: Please note that the above analysis is not an investment suggestion by “Capitalcore Ltd”. This post has been published only for educational purposes.