- January 6, 2025
- Posted By: james w
- Category: Market News
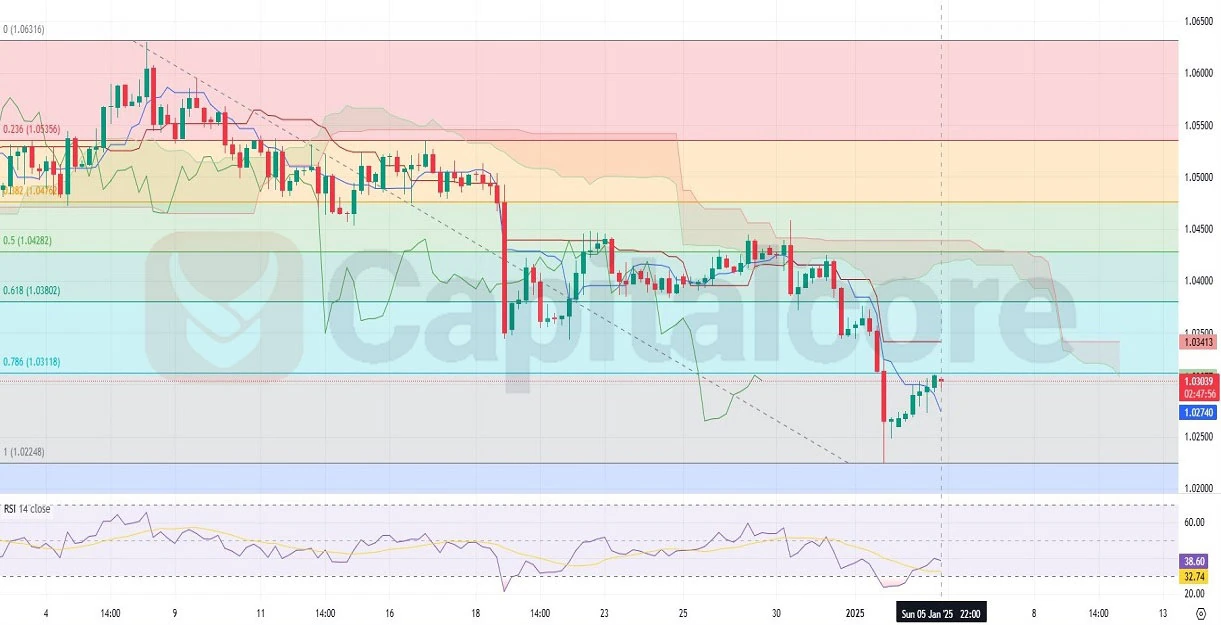
EURUSD H4 Trend Recovery and Market Insight
The EURUSD, commonly known as “Fiber,” is the most actively traded currency pair in the forex market, representing the exchange rate between the Euro and the US Dollar. It serves as a barometer for global economic strength, monetary policies, and market sentiment due to its high liquidity and correlation with major economic indicators.
Today, the EUR/USD is navigating a mix of fundamental drivers, including the German CPI release, which reflects inflationary pressures in the Eurozone, and low liquidity caused by the Italian Epiphany holiday, which could lead to irregular volatility. While stronger-than-expected German CPI data could support the Euro by bolstering expectations for further European Central Bank tightening, traders are also closely monitoring US PMI reports and remarks from Federal Reserve Governor Lisa Cook for insights into future US interest rate policies. These events could either amplify the USD’s strength or weaken it, depending on their outcomes, making the EURUSD’s price highly sensitive to today’s market developments.

Chart Notes:
• Chart time-zone is UTC (+02:00)
• Candles’ time-frame is 4h.
The EURUSD H4 chart indicates a clear recovery from a bearish trend, as shown by the Fibonacci retracement levels and the Ichimoku Cloud. The price reversed sharply after touching the 1.000 Fibonacci level and has since recorded several bullish candles. This rally brought the EUR-USD pair up to the 0.786 Fib level, a key resistance point. The opening candles of the current session have been red, suggesting a potential pullback or consolidation phase. Traders should closely watch whether the price can break above the 0.786 Fib resistance, signaling continuation of the bullish trend, or if it retreats further. The Ichimoku Cloud indicates neutral-to-bearish sentiment as the price remains under the cloud, reflecting resistance at higher levels. However, the RSI is climbing from oversold levels and currently hovers around 38.6, indicating improving bullish momentum. While the near-term price action shows hesitation, breaking through the resistance could confirm bullish continuation. Conversely, failure to hold above the 0.786 Fib level could lead to a bearish reversal.
• DISCLAIMER: Please note that the above analysis is not an investment suggestion by “Capitalcore LLC”. This post has been published only for educational purposes.