EURUSD RSI and Fibonacci Levels in Focus
EUR/USD forex pair, often referred to as “Fiber,” is one of the most traded currency pairs in the Forex market, reflecting the value of the Euro against the U.S. Dollar. This pair is highly influenced by the economic and political events in both the Eurozone and the United States, making it a vital indicator of the global economy’s health. Today’s upcoming news includes significant economic reports from both the Eurozone and the U.S., which are expected to impact the direction of EUR/USD price.
From a fundamental perspective, key reports from the Eurozone, such as industrial output, foreign trade balance, and employment data, will be essential to monitor. Better-than-expected results could strengthen the Euro, especially if industrial output and foreign trade data outperform forecasts, indicating robust economic health. On the U.S. side, the upcoming Non-Farm Payrolls (NFP) and unemployment rate data are likely to dictate the market’s sentiment toward the U.S. Dollar. A positive NFP figure would indicate a stronger labor market, potentially boosting the Dollar. Additionally, speeches from key Federal Reserve officials, like John Williams and Christopher Waller, may provide clues on future U.S. monetary policy. Any hints of further interest rate hikes could support the Dollar, pressuring the EUR/USD lower.
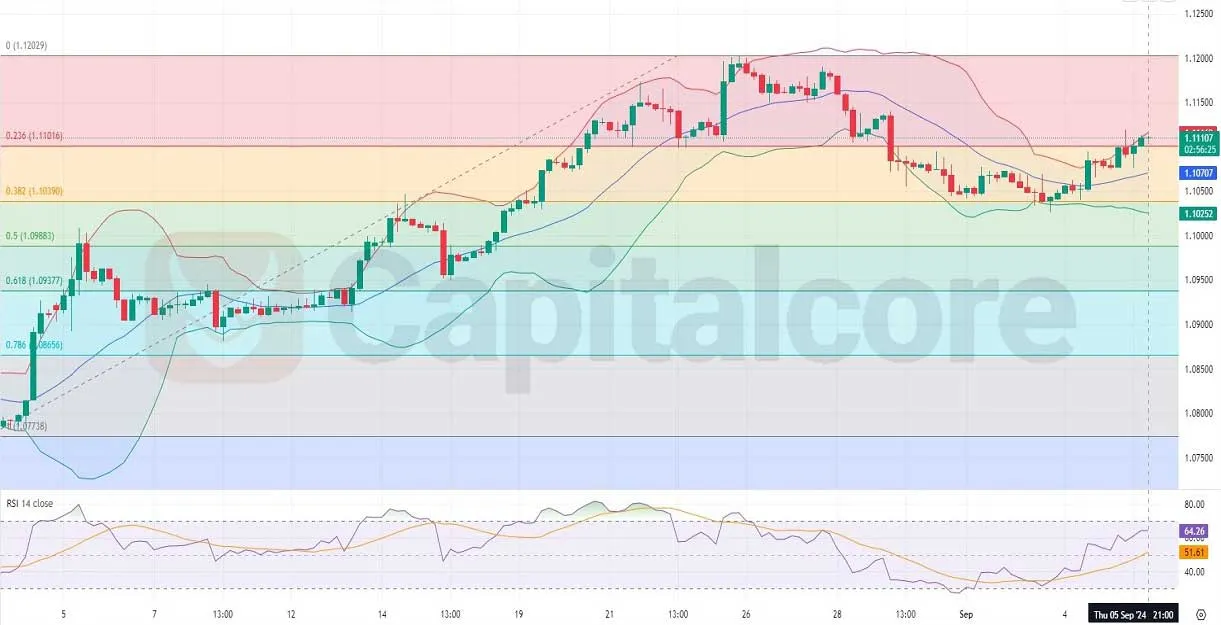
Chart Notes:
• Chart time-zone is UTC (+03:00)
• Candles’ time-frame is 4h.
In the technical analysis based on the EUR/USD H4 chart, the pair is showing a clear uptrend, supported by the last three bullish candles. The price is currently moving from the middle Bollinger Band toward the upper band, even touching the upper line. This suggests increasing volatility and a possible continuation of the upward movement. Additionally, the price has moved from the 0.382 Fibonacci retracement level to the 0.236 level and is now hovering near this point, showing potential to rise further toward the 0.0 Fibonacci retracement level. The Bollinger Bands are widening, indicating higher market volatility, while the RSI is gradually climbing, signaling further bullish momentum. If the price breaks the 0.236 Fibonacci level convincingly, the next target could be the 0.0 Fibonacci level around 1.12029, with strong support at the 1.1050 region.
• DISCLAIMER: Please note that the above analysis is not an investment suggestion by “Capitalcore LLC”. This post has been published only for educational purposes.