- Posted By: james w
- Category: Market News
Bollinger Bands and RSI Indicate Bullish Bias for EUR/USD
The EUR/USD forex pair, often nicknamed “Fiber,” is one of the most traded currency pairs in the forex market, reflecting the economic relationship between the Eurozone and the United States. Today, the Euro may react to economic data releases like the S&P Global’s PMI for the Eurozone, a key gauge of manufacturing health. As PMI readings above 50.0 suggest expansion and below indicate contraction, stronger-than-expected numbers could lend support to the Euro by hinting at economic resilience. Conversely, weak PMI data might add downward pressure on the Euro, signaling a slowdown. Meanwhile, U.S. data, including the Federal Reserve’s lending standards and Census Bureau’s manufacturing orders, will also provide insights into the USD’s strength, possibly driving EUR/USD volatility.

Chart Notes:
• Chart time-zone is UTC (+02:00)
• Candles’ time-frame is 4h.
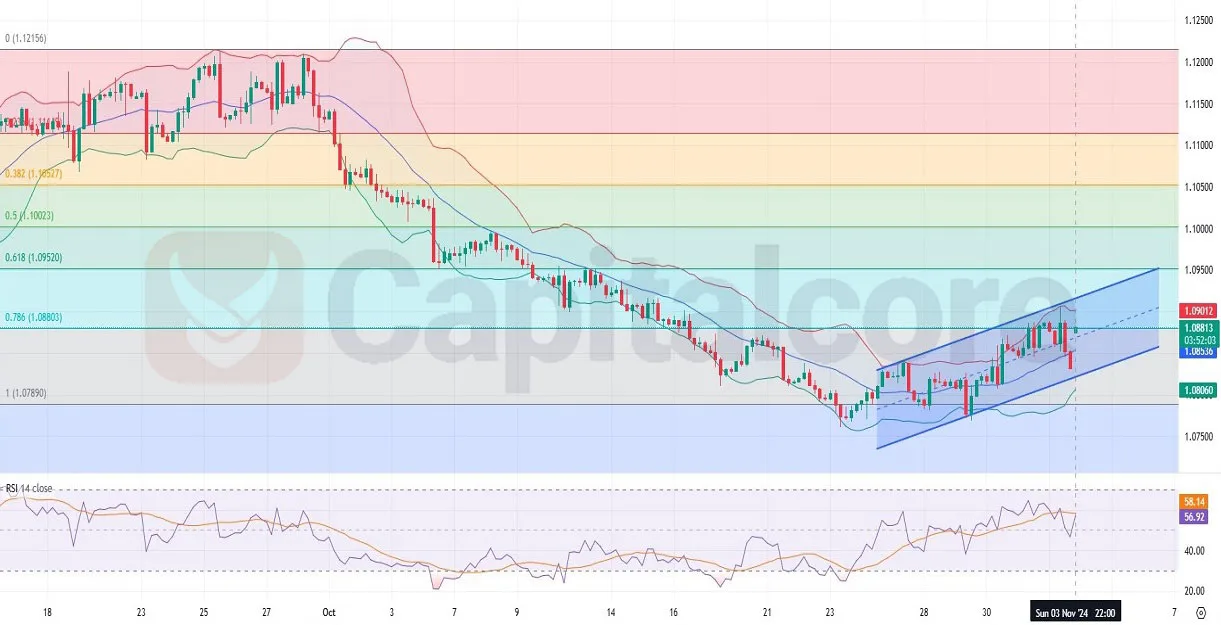
Analyzing the EUR/USD H4 chart, we observe the price moving within a bullish channel, showing signs of shifting from a previous bearish trend. The Fiber’s price is currently trading near the 0.786 Fibonacci retracement level at approximately 1.0880, indicating a potential reversal point. Bollinger Bands show the price in the upper half, suggesting moderate bullish momentum, while the recent gap at market open highlights renewed buying interest. Despite the last two bearish candles at the close of last week, the current price movement within the channel suggests further bullish potential if it breaks the 0.786 level. The RSI is positioned near the 58 level, indicating a bullish sentiment but not yet in overbought territory, leaving room for continued upward movement.
•DISCLAIMER: Please note that the above analysis is not an investment suggestion by “Capitalcore LLC”. This post has been published only for educational purposes.