H4 Chart Bullish Signals Explained
The EUR/USD forex pair, often referred to as the “Fiber,” is a major currency pair that represents the exchange rate between the Euro and the US Dollar. This pair is highly popular among traders due to its liquidity and volatility, making it a key focus in the forex market. In the current EUR/USD H4 candlestick chart, we observe an interesting setup that suggests a potential bullish move is on the horizon.
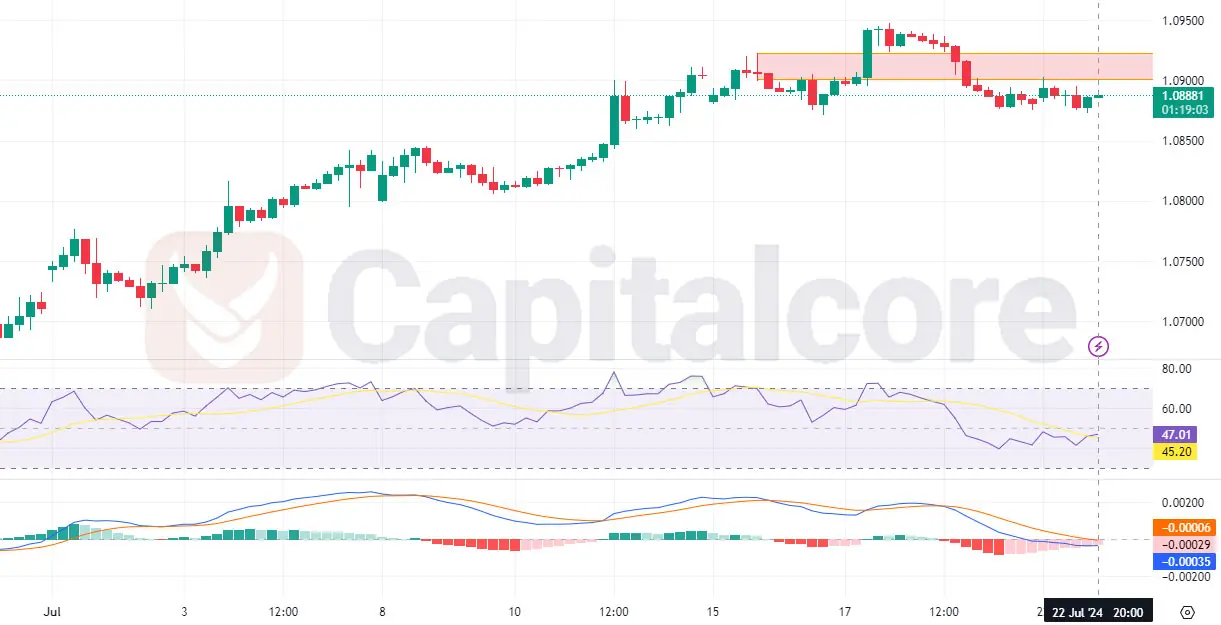
Chart Notes:
• Chart time-zone is UTC (+03:00)
• Candles’ time-frame is 4h.
The MACD indicator on EURUSD chart is showing signs of entering an ascending phase, indicating increasing bullish momentum. Additionally, the RSI, which has recently started a smooth upward trajectory from below 50, further supports the bullish sentiment on the Fiber. Analyzing the price actions of this forex pair, it’s evident that EURUSD has been forming higher highs without recording a lower low, strengthening the bullish outlook. For traders and investors looking for EUR/USD H4 price action and chart forecast, today’s analysis highlights an opportunity for a bullish continuation in the short term.
In summary, the combination of technical indicators and price action patterns on the EUR/USD H4 chart suggests a favorable scenario for a bullish move. As the MACD and RSI both indicate strengthening bullish momentum, and the price action shows consistent higher highs, the EUR/USD pair looks poised for further gains.
• DISCLAIMER: Please note that the above analysis is not an investment suggestion by “Capitalcore Ltd”. This post has been published only for educational purposes.