EURUSD H4 Technical Review Key Indicators and Price Action
The EUR/USD, often referred to as the “Fiber,” is a highly traded currency pair that represents the exchange rate between the Euro and the US Dollar. It is one of the most liquid pairs in the forex market, known for its tight spreads and significant volatility during economic data releases. Today, market participants are keenly observing the upcoming remarks by Federal Reserve Governor Christopher Waller and the release of the Leading Indicators from the Conference Board, both of which could provide crucial insights into the direction of U.S. monetary policy. If Waller’s remarks lean hawkish, we might see strength in the USD, which could weigh on the EUR/USD pair. Additionally, stronger-than-expected Leading Indicators could further bolster the dollar, adding downward pressure on the pair.
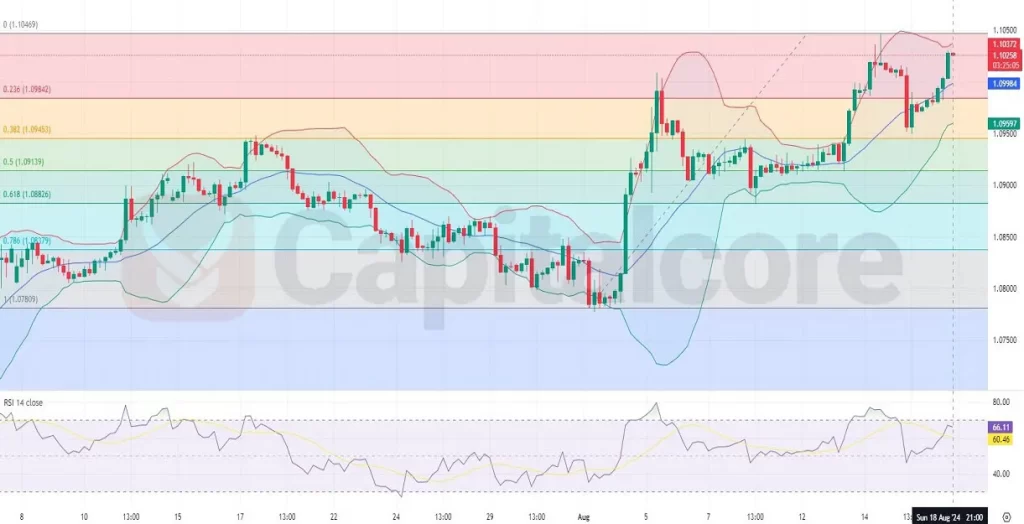
Chart Notes:
• Chart time-zone is UTC (+03:00)
• Candles’ time-frame is 4h.
In the H4 chart of EUR/USD, the price is currently in a bullish trend, moving upward from the middle Bollinger Band towards the upper band, demonstrating strong upward momentum with 6 out of the last 10 candles being bullish. The price is navigating between the 0.236 Fibonacci retracement level and the 0.0 level, indicating potential resistance ahead. The RSI indicator, which is hovering around 66, suggests that the pair is nearing overbought conditions but still has some room for upward movement before it hits significant resistance.
DISCLAIMER: Please note that the above analysis is not an investment suggestion by “Capitalcore LLC”. This post has been published only for educational purposes.