The support level looks too fragile to hold the price
BTC price started a sharp descending wave on April the 5th 2022 which caused this crypto asset value to descend up to more than 62% until 18th of June, when the price line reached to a support level and was slightly pumped. The price line now is just above this support zone and a strong ascending wave is possible to occur.
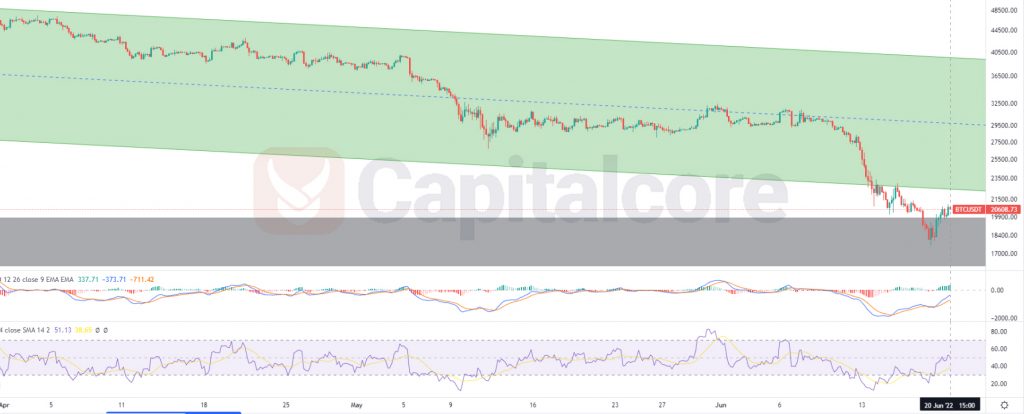
Chart Notes:
• Chart time-zone is UTC (+03:00)
• Candles’ time-frame is 4h.
The price line on BTC price chart is currently on 20608, which would be Just above a static support zone, and below the base line of a descending wave. The green zone on the chart indicates the descending wave and the gray zone is the static support. RSI is showing positive divergence and RSI is currently lying in overselling area. MACD is showing potential for a bullish wave to occur. Fear and Greed index is also showing extreme fear in Crypto market and a bullish wave is highly possible to take place shortly. Traders can be waiting for the price line to touch the gray support zone once more and then they can enter long positions heading to 28500 and 35000 after that.
Please note that this theory would be potential of taking place as long as the price line has not broken below the gray zone.
• DISCLAIMER: Please note that the above analysis is not an investment suggestion by “Capitalcore Ltd”. This post has been published only for educational purposes.