Bullish Momentum in EURUSD: Ichimoku Cloud and MACD Analysis
The EUR/USD forex pair, commonly referred to as “Fiber,” is a major forex pair that captures the exchange rate between the Euro and the U.S. Dollar. It is one of the most traded currency pairs in the forex market, known for its liquidity and relatively tight spreads. As the economic calendar for today unfolds, key data releases, particularly from the U.S. and U.K., are poised to impact the pair’s forecast today. The EUR/USD fundamental analysis today is driven by a series of economic indicators. The U.S. is set to release data such as Jobless Claims and PMI figures, which are vital for gauging the health of the U.S. economy. Better-than-expected Jobless Claims numbers could strengthen the USD, putting downward pressure on the EUR/USD. On the other hand, the PMI data from both the U.S. and Europe will provide insights into the manufacturing and service sectors’ performance. For the Eurozone, weaker-than-expected PMI numbers could further depreciate the Euro, enhancing the Fiber’s bearish outlook. Additionally, the U.K.’s economic data, particularly the PMI and CBI Industrial Trends Survey, will indirectly influence the pair by affecting overall market risk sentiment.
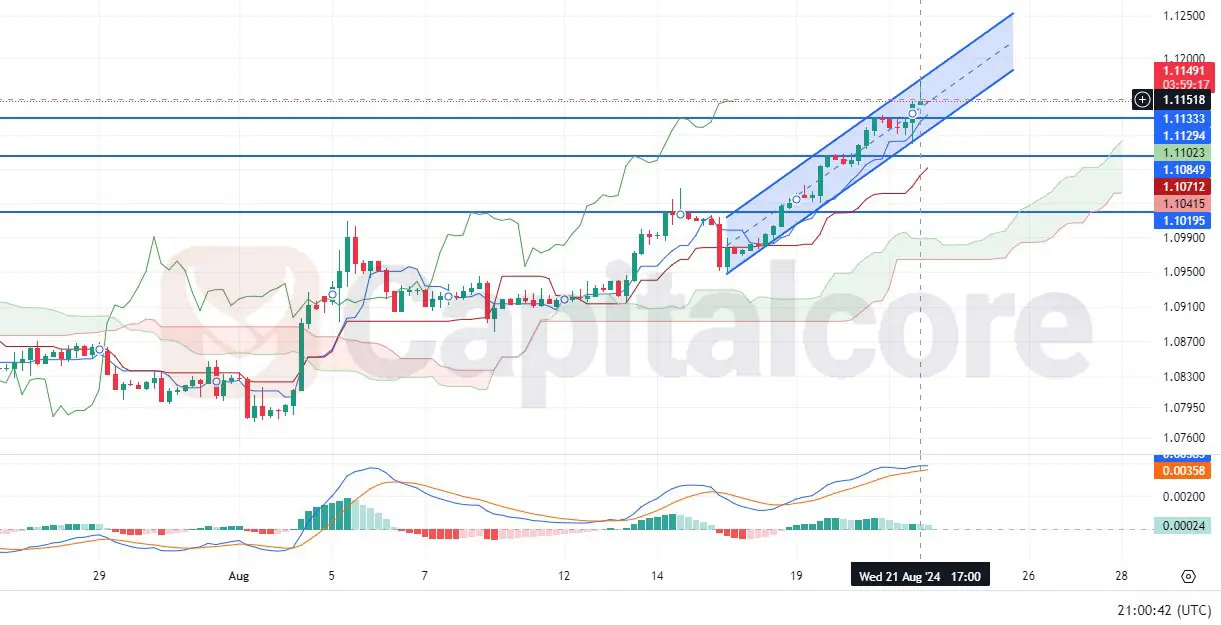
Chart Notes:
• Chart time-zone is UTC (+03:00)
• Candles’ time-frame is 4h.
In the EUR/USD H4 chart, we observe the pair’s strong bullish momentum, as indicated by its price action residing within an ascending channel. The Ichimoku Cloud supports this bullish trend, with the price action above the cloud, signaling strong upward momentum. The Tenkan-sen and Kijun-sen lines are in a bullish alignment, further affirming the uptrend. Moreover, the MACD indicator shows bullish momentum, with the MACD line above the signal line and increasing positive histogram bars. Key resistance levels are noted around 1.1149 and 1.1151, while support levels are found near 1.1084 and 1.1071. A sustained break above the upper resistance could pave the way for further gains, while a failure to maintain this level might lead to a correction towards the support zones.
• DISCLAIMER: Please note that the above analysis is not an investment suggestion by “Capitalcore LLC”. This post has been published only for educational purposes.