- August 7, 2024
- Posted By: Ethan Williams
- Category: Market News
Gold Price Prediction for 8-7-2024
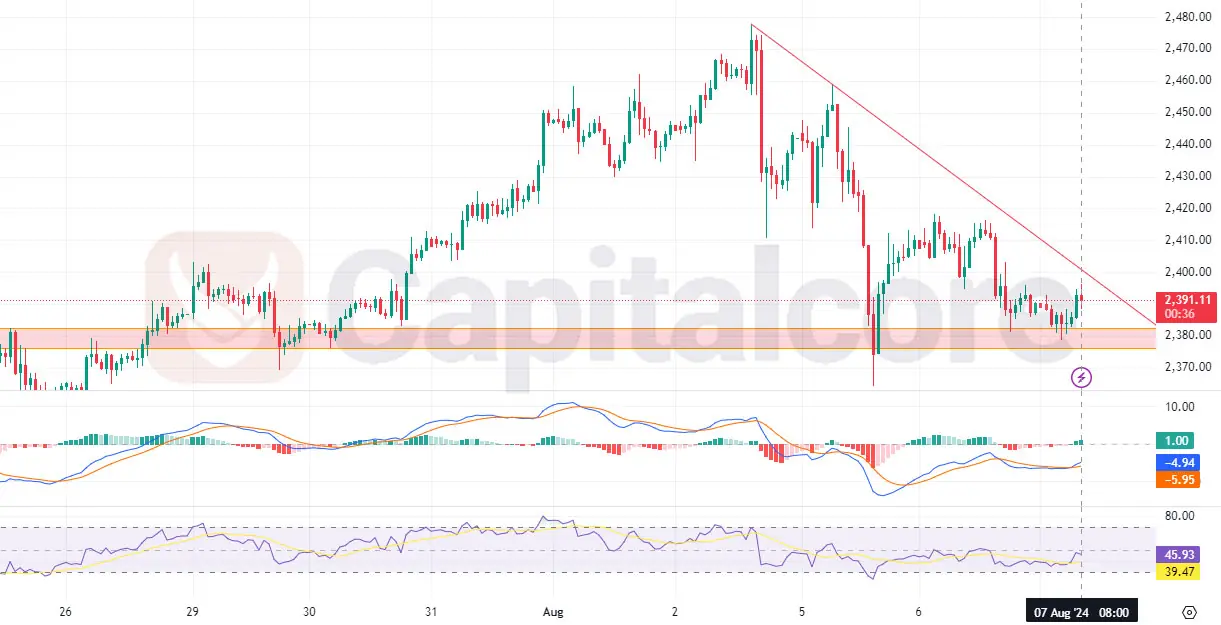
The “gold” also known as “XAU/USD,” is showing intriguing movements in its price chart, suggesting a potential shift in momentum. As the gold price descends towards a notable support level, traders and investors are keenly observing the market for signs of a reversal. The current trajectory indicates a testing phase for this support zone, which could act as a critical pivot point for future price action. With the RSI oscillating around the 50 mark, it reflects a state of market equilibrium, suggesting neither strong bullish nor bearish dominance at the moment. This balance is crucial for traders looking for gold price predictions, as it sets the stage for a possible trend reversal.
Chart Notes:
• Chart time-zone is UTC (+03:00)
• Candles’ time-frame is 4h.
Adding to the optimistic outlook, the MACD is hinting at a bullish wave on the horizon. The convergence of these technical indicators provides a compelling case for a potential upward move, making it a focal point for those interested in new gold analysis. The MACD’s positive divergence and the RSI’s stabilization reinforce the possibility of an impending bullish breakout, making it a pivotal moment for gold price forecasts. As the market approaches this crucial juncture, traders are closely monitoring these signals to make informed decisions about the future direction of the gold price, highlighting the growing anticipation for a bullish trend in the near term.
DISCLAIMER: Please note that the above analysis is not an investment suggestion by “Capitalcore LLC”. This post has been published only for educational purposes.: Please note that the above analysis is not an investment suggestion by “Capitalcore LLC”. This post has been published only for educational purposes.
