- January 13, 2025
- Posted By: mia
- Category: Market News
USDCHF Fibonacci Retracement Levels Explained
The USDCHF currency pair, often referred to by its nickname “Swissie,” represents the US Dollar against the Swiss Franc. Known for its safe-haven appeal, the Swiss Franc is often influenced by global economic events, while the US Dollar reflects the performance of the largest economy in the world. Today, the US Treasury Monthly Budget release is expected to shed light on the federal government’s income versus expenditure trends, which could have significant implications for the USD. On the CHF side, SECO’s Consumer Confidence Index will provide insight into Swiss economic optimism, a critical factor driving the Franc’s strength. If the US report surprises with a better-than-expected surplus and Swiss consumer confidence lags, USDCHF could see further bullish momentum.
Chart Notes:
• Chart time-zone is UTC (+02:00)
• Candles’ time-frame is 4h.
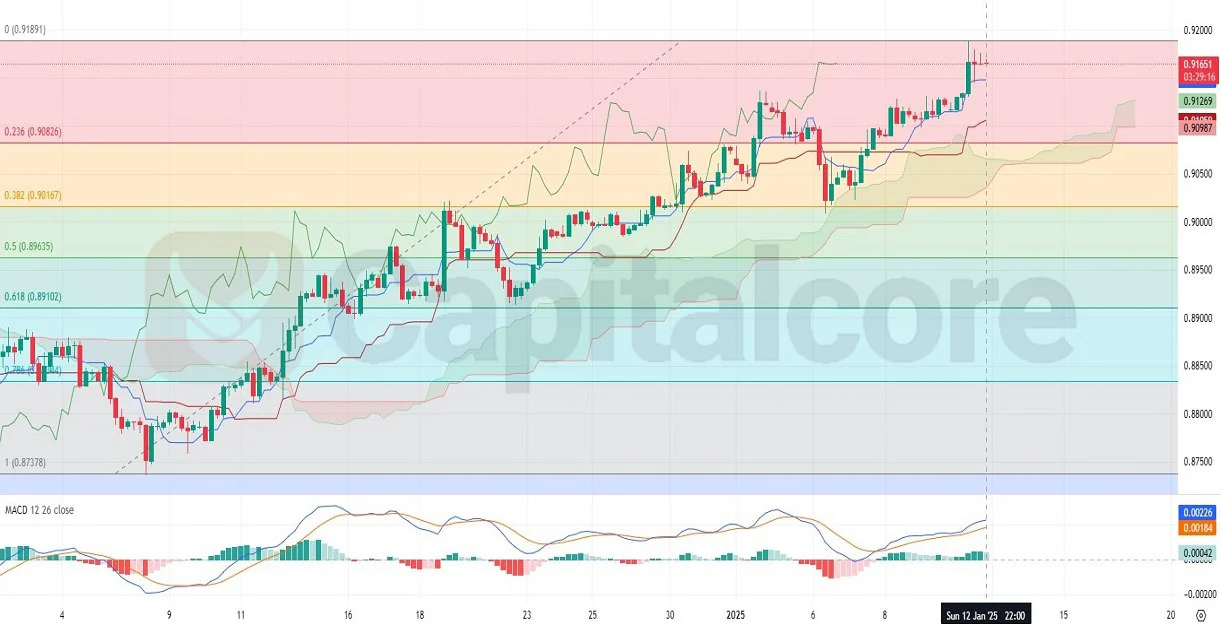
The USDCHF H4 chart analysis reveals that the pair is in a bullish trend, as the price continues to trade above the Ichimoku cloud, suggesting strong support levels. While the price touched the 0 Fibonacci retracement level, it recently retraced slightly, forming three red bearish candles. However, the candles remain above the 0.236 Fibonacci retracement level, which acts as immediate support. The MACD and histogram still signal bullish momentum, but a slight weakening of the MACD histogram suggests potential consolidation or a minor retracement before another bullish attempt. If the price sustains above the Ichimoku cloud and 0.236 Fib level, the bullish trend could resume towards higher Fibonacci levels.
•DISCLAIMER: Please note that the above analysis is not an investment suggestion by “Capitalcore LLC”. This post has been published only for educational purposes.
