- July 30, 2024
- Posted By: james w
- Category: Market News
EUR/GBP Forecast: Bollinger Bands, Parabolic SAR, and Economic Indicators
The EUR/GBP currency pair, often referred to as the “Chunnel” due to the Chunnel (Channel Tunnel) connecting Britain and mainland Europe, represents the exchange rate between the Euro and the British Pound. This pair is influenced by economic data releases, geopolitical events, and central bank policies from both the Eurozone and the United Kingdom.

Chart Notes:
• Chart time-zone is UTC (+03:00)
• Candles’ time-frame is 4h.
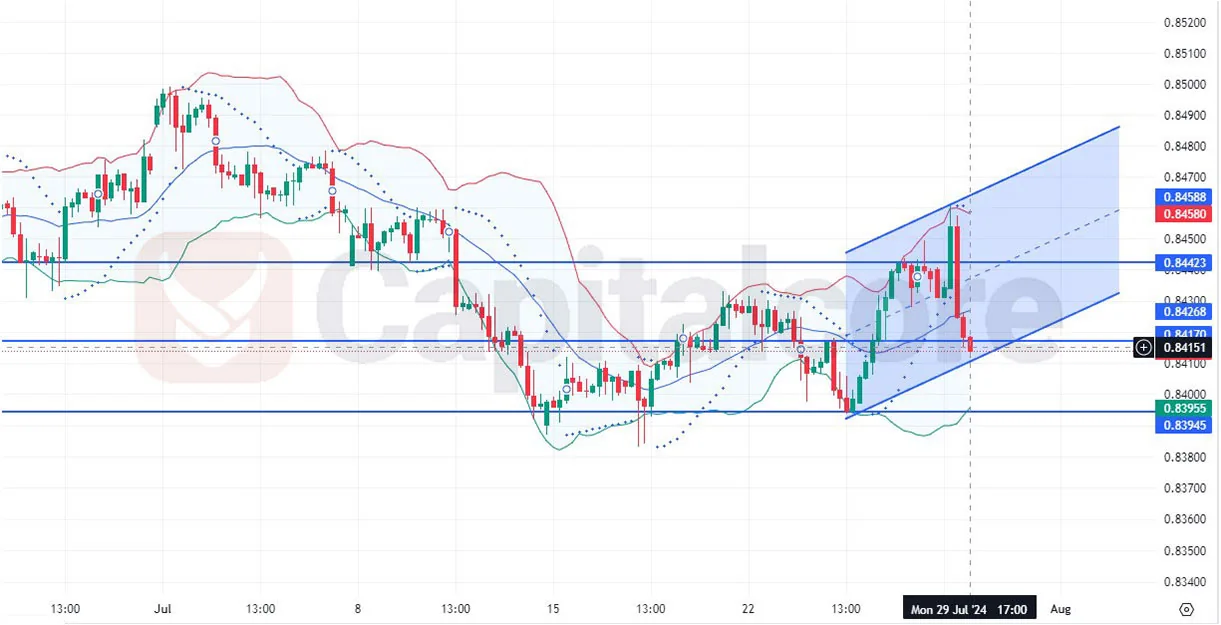
The EUR/GBP fundamental analysis today is navigating through various economic indicators from both the Eurozone and the UK, with significant upcoming data from INSEE on consumer spending and GDP, as well as Destatis CPI figures, which are expected to influence the Euro. On the UK side, the British Retail Consortium’s price index and Debt Management Office’s bond yields are in focus. Now to the pair’s technical analysis, the EUR/GBP H4 chart shows the price trading within a rising channel, indicating a potential bullish trend. The Chunnel’s price action suggests a pullback from the upper boundary of the channel, with the price testing the lower Bollinger Band, suggesting potential support around the current level. The Parabolic SAR dots are above the price, indicating a bearish phase. Immediate support is at 0.84151, with critical support at 0.83955, and resistance levels at 0.84423 and 0.84588. Positive economic data releases could strengthen the Euro, while strong UK retail data could support the Pound, with bond yields providing insights into investor confidence and interest rate expectations.
• DISCLAIMER: Please note that the above analysis is not an investment suggestion by “Capitalcore LLC”. This post has been published only for educational purposes.