Bullish signals have been issued
GBP/AUD started a descending trend line on 18th of February 2022 and has descended more than 6.1% so far. The price line at the moment has reached to a support zone and different indicators are showing strong potential of a bullish wave to occur.
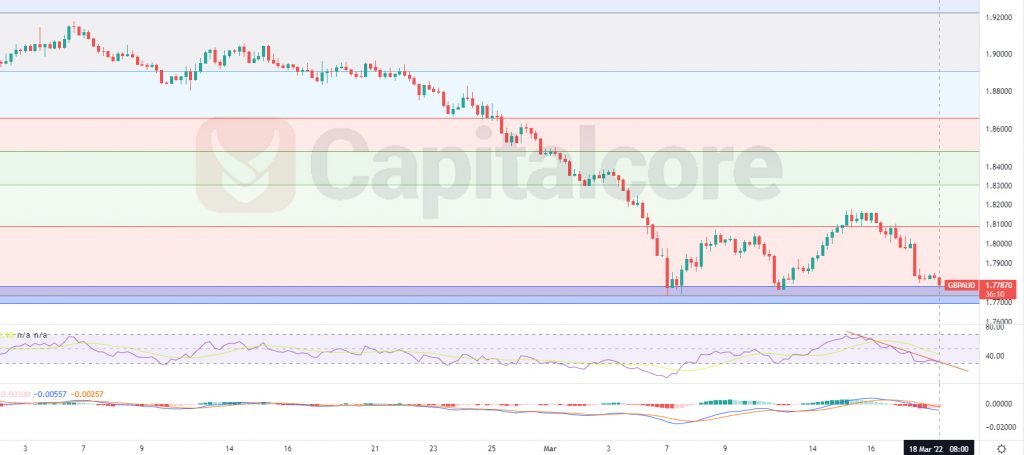
Chart Notes:
• Chart time-zone is UTC (+03:00)
• Candles’ time-frame is 4h.
The price line at the moment is showing 1.7787 at the moment Which would be just above the resistance level, which has been shown as a blue box on the chart. This area is considered important for this pair, as it has been able to pump the price line a couple of times before. RSI is almost on 33 and is approaching to the overselling area; positive divergence has also occurred on the chart. MACD is showing weakness in bearish trend. Traders can be waiting for the price line to trigger a bullish move, then they can target 1.805 and 1.83 as the possible distention of the ascending wave.
• DISCLAIMER: Please note that the above analysis is not an investment suggestion by “Capitalcore Ltd”. This post has been published only for educational purposes.