The price line is on the trend line
GBP/CAD started a descending wave on 22nd of February 2022 and descended about 4.5% until 11th of March 2022. The price line, then, once again raised to retest the dynamic resistance and right now the price line once again is on the descending trend line and therefore the current position of the price line is an important zone for the price line.
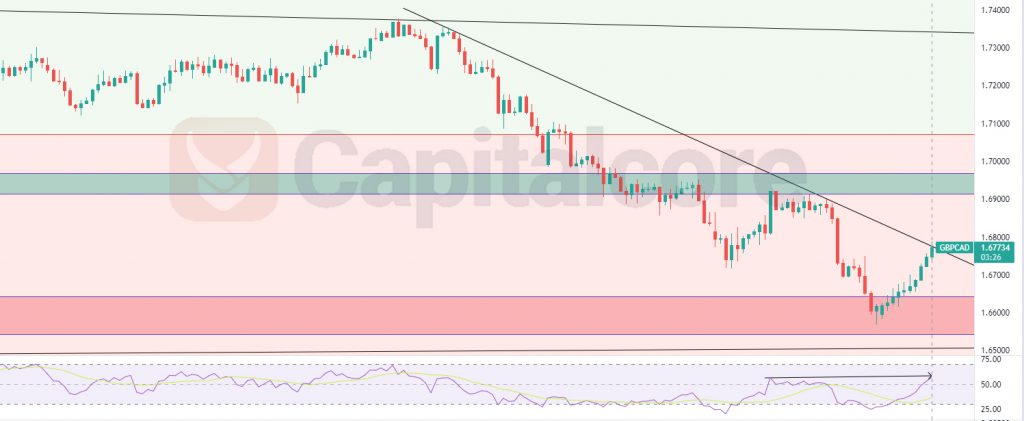
Chart Notes:
• Chart time-zone is UTC (+03:00)
• Candles’ time-frame is 4h.
the price lien at the moment is showing 1.67734. The area equals to the position of the dynamic trend line. The green zone above the trend line shows a resistance zone, the area between the green and the light red zone, shows the position of level 0.236 of the Fibonacci retracement. The red box below the price line is the support zone to which the price line has reacted a couple of times. The descending black line indicates the dynamic resistance within which the descending wave is taking place. RSI is almost on 57 and is issuing negative divergence signal. MACD is showing bullish trend on going. Traders can be watching to detect any descending trigger to enter the market. The target for the wave could be considered on 1.66. Buyers also can be waiting for the price line to break above the dynamic resistance, then they can enter long positions . The target for the ascending wave could be considered on 1.69 and 1.705.
• DISCLAIMER: Please note that the above analysis is not an investment suggestion by “Capitalcore Ltd”. This post has been published only for educational purposes.