Descending trend line is broken
GBP/CAD started a sharp bearish rally on 23rd of February 2022; the price on this pair descended more than 9.1% until 13th of May 2022, when the price line reached out to a strong support zone in weakly time frame, and finally on 20th of May, the price line broke above the descending trend line. Right now the price line is potential of ascending majorly.
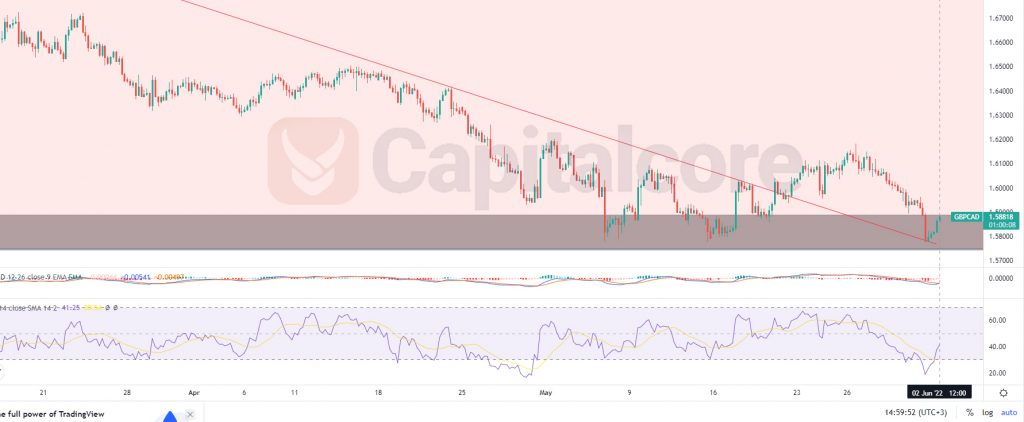
Chart Notes:
• Chart time-zone is UTC (+03:00)
• Candles’ time-frame is 4h.
The price line is currently showing 1.58818, which would be just on the strong weakly support zone. The support zone is indicated as a gray area below the chart. As you can see, the descending slope decreased, as the price line got closer to the support zone and then broke above the trend line. The price line is now trying to enter bullish phase after having a retest of the broken trend line. RSI is issuing positive divergence and MACD is showing strong potential for an ascending wave. Long positions are way more recommended on this pair and the target for bulls can be considered on 1.7 and 1.77. Please consider that, the ascending chance would highly reduce if the price line breaks below 1.565.
• DISCLAIMER: Please note that the above analysis is not an investment suggestion by “Capitalcore Ltd”. This post has been published only for educational purposes.