An ascending wave might occur shortly
GBP/CHF, after forming a new climax on the chart, in 5th of April 2021, entered a correction phase within a bearish channel and after several reactions to the top, mid and base line of the channel, the price line is now on level 0.618 of the Major bullish wave as well as the base line of the channel, therefore a bullish leg might occur within the bearish channel.
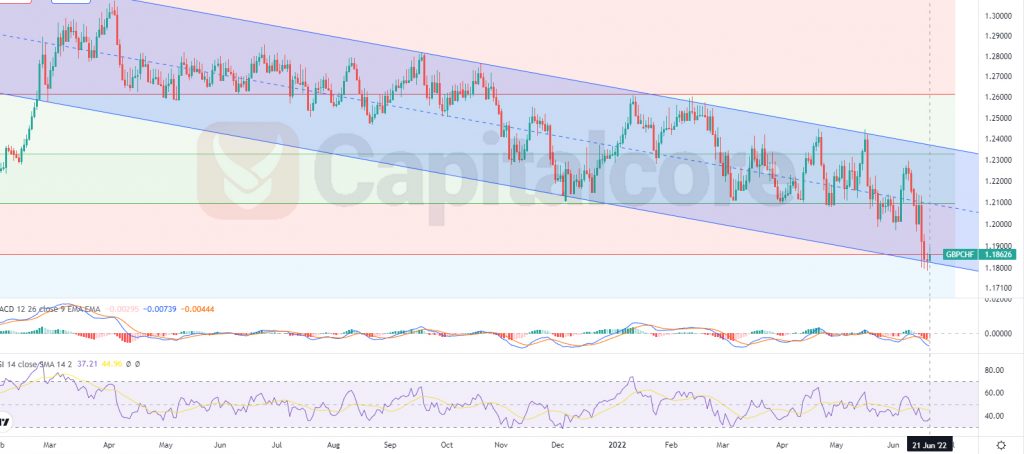
Chart Notes:
• Chart time-zone is UTC (+03:00)
• Candles’ time-frame is daily.
The price line is currently at 1.18626, which would be just above the base line of the bearish channel as well as level 0.618 of the Fibonacci retracement. The bearish channel is highlighted with light blue color on the chart and the red area represents level 0.618 of the Fibonacci retracement. RSI is below 50 and MACD is showing potential for an ascending leg to take place. The descending slope of the chart, however, is increasing and trading with high volume is not recommended, if your risk appetite is not big.
Buyers should keep a sharp eye on GBP/CHF price chart and after any ascending trigger is executed, they can enter long positions. The target for the ascending wave could be considered on 1.209 and 1.2328. In case the price line breaks above the top line of the channel, reaching out to 1.26 would not be a hard achievement for GBP/CHF.
Please consider that, regarding the price compaction and sideway market on going, the risk of opening a trade on this pair, needs to be taken into the consideration; traders also need to bear in mind that, in case the price line breaks below the base line of the channel, the chance would be more with bears to take over the market, than the bulls.
• DISCLAIMER: Please note that the above analysis is not an investment suggestion by “Capitalcore Ltd”. This post has been published only for educational purposes.