Descending channel, still valid
After a significant growth (starting on 11th of September 2020 and ending on 5th of April 2021) GBP/CHF price started a descending wave within a bearish channel. Several reactions has been made to the top, mid and base line of the channel but the channel has not been broken yet and is still valid.
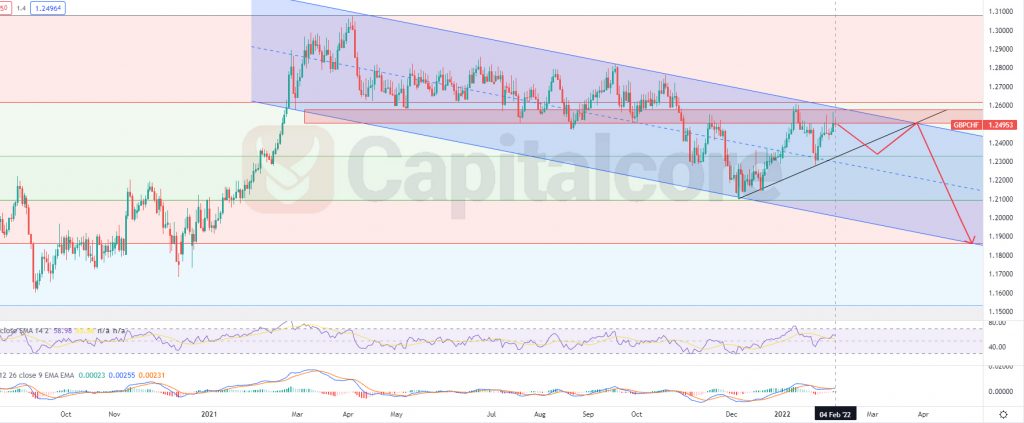
Chart Notes:
• Chart time-zone is UTC (+03:00)
• Candles’ time-frame is daily.
At the moment, the price line on GBP/CHF chart is on 1.24953 and is almost at the top of the channel. There is a temporary, dynamic support below the price line that has been shown as a black line below the price line. MACD is showing the commencement of an ascending wave. RSI is on 60 and has started a descending phase. There is a important level on 1.25 – 1.26 ; the price line has made several reactions to this area and is expected to have another reaction to the same level. As the overall look of the chart is bearish, sellers would have a bigger chance of winning. Traders can be waiting for the price line to break below the trendline and on the retest they enter short positions. The target for the descending wave could be considered on 1.2 and 1.185. The possible price move is indicated on the chart, as a red arrow. Please consider that breaking above the channel would highly reduce the descending chance.
• DISCLAIMER: Please note that the above analysis is not an investment suggestion by “Capitalcore Ltd”. This post has been published only for educational purposes.