Britain days are seem to be over
Despite the fundamental reports on GBPUSD, the disappointing US data did not empower GBPUSD yesterday. On the chart the price line has ascended largely and after reaching to the weakly resistance, started a descending wave. Different indicators are issuing trend reversal signals and descending wave is about to occur.
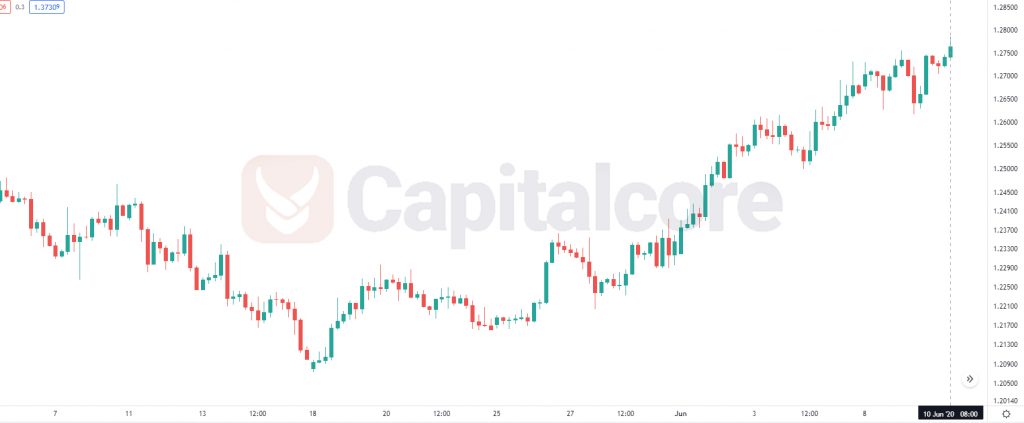
Chart Notes:
• Chart time-zone is UTC (+03:00)
• Candles’ time-frame is 4h.
The support rests at 1.26220 with resistance at 1.27820 which both lines are above the weekly pivot point at 1.25760. The EMA of 10 is moving with bearish bias in the long term ascendant channel and it is above the EMA of 200 and the EMA of 100. The RSI is falling below level 50, the Stochastic is showing downward momentum and the MACD line is below the signal line in the negative territory. The ADX is showing sell signal.
The support level breakthrough will confirm the correction pattern towards level 50 of Fibonacci at 1.24500 however there might be a strong resistance around the weekly pivot line.
• DISCLAIMER: Please note that the above analysis is not an investment suggestion by “Capitalcore Ltd”. This post has been published only for educational purposes.