- October 5, 2021
- Category: Market News
GBP/USD, on a critical spot
USD is still getting empowered day by day. During the past 3 days, GBP could recover some of the lost against USD. The price right now is just below a very strong resistance level and is ascending within a channel. The channel has not been broken to either side yet and the overall look of the chart is bearish.
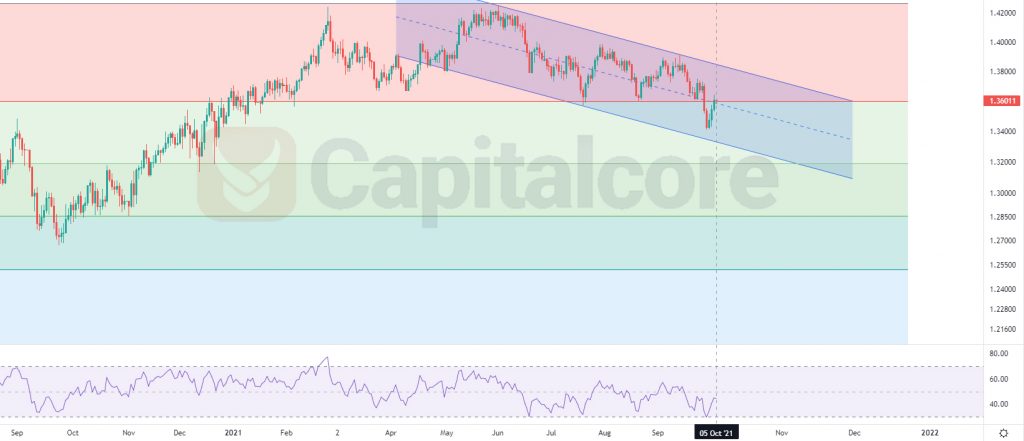
Chart Notes:
• Chart time-zone is UTC (+03:00)
• Candles’ time-frame is daily.
The price is right now on a very strong resistance at 1.36 – 1.37. This level is the mid lane of the descending channel and also 0.236 of the Fibonacci retracement. The last descending wave could break below the previous lower low, RSI indicator is showing 46 and is in the lower half. no trend reversal signal has been issued yet. We expect the price to have another bearish leg after the price line retests 0.236 of the Fibonacci retracement. In case the price can not break above this resistance, sellers can target 1.319 as the First TP and 1.25 as the second. On the other hand, breaking above the resistance at 1.36 could be followed by a bullish leg. The target of the bullish wave would be 1.39 and the next possible target is 1.42
• DISCLAIMER: Please note that the above analysis is not an investment suggestion by “Capitalcore Ltd”. This post has been published only for educational purposes.