- January 12, 2023
- Category: Market News
The price line is on a strong resistance
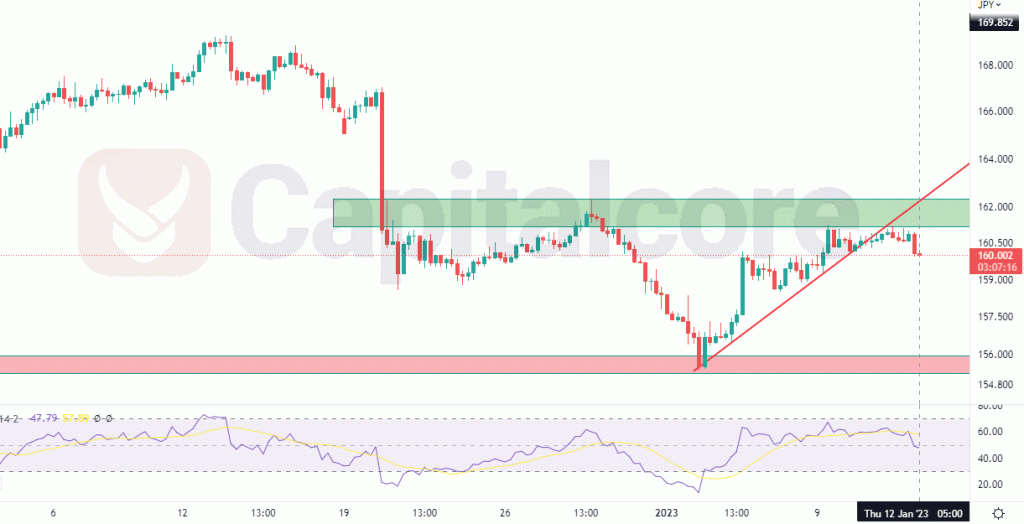
After a major loss, GBP/JPY price line started moving sideway, bouncing between two levels at 155-163. Currently the price line has reached to a strong resistance level, enlarging the possibility of an upcoming ascending wave. Different indicators are issuing bearish signals and the possibility of an upcoming descending wave is very high at the moment.

Chart Notes:
• Chart time-zone is UTC (+03:00)
• Candles’ time-frame is 4h.
The price line on GBP/JPY is showing 160 at the moment. The red area below the price line indicates a resistance level which has already been able to pumped price line. As the price line was sharply revised when reaching to this area, it is considered to include a great deal of demands. The green zone above the area has dumped the price line several times and therefore is considered as a strong resistance. RSI is issuing negative divergence, confirming the possibility of a bearish trend reversal. The red ascending line reflects the bullish trend line which formed the last ascending wave; this trend line is now broken and after a possible retest of the green area, traders can expect to see the price line moving towards the red support zone.