The price line is approaching a significant resistance zone
The recent price line bounces on GBP/JPY price chart has indicated a strong resistance level on the chart. This level seems to include a big deal of sell positions and has already been able to dump the price line several times. The price line on GBP/JPY is once more approaching to this level and a bearish wave could appear shortly, on the chart.
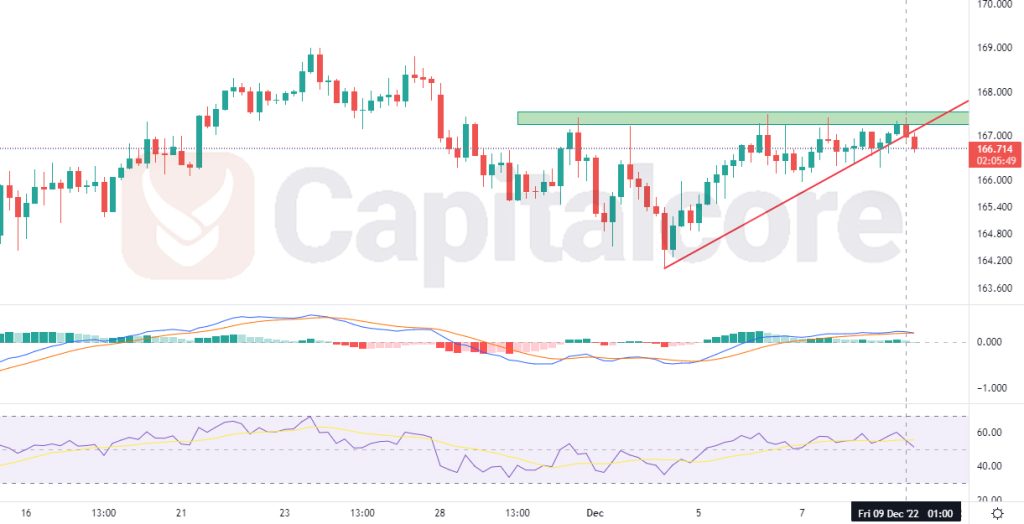
Chart Notes:
• Chart time-zone is UTC (+03:00)
• Candles’ time-frame is 4h.
On November 11, 2022, the GBPJPY price line started an ascending trend. On the price chart, the price movement led to the formation of a bullish trend line, which is visible as a red ascending line. The price line’s most significant levels of support and resistance are shown by the green areas above and below it. The price line has already crossed below the indicated trend line and is now moving toward the resistance level, as can be seen on the chart below. In order to enter short positions and expect to see the price on the support zones at 162.000, 159.011 and 155.555, sellers should expect the price line to have another retest of the green zone above the price line.
• DISCLAIMER: Please note that the above analysis is not an investment suggestion by “Capitalcore Ltd”. This post has been published only for educational purposes.