The price line is about to take a bearish leg
GBP/JPY started moving bullishly on 23rd of January 2023; as a result of this bullish leg, the price line on this chart ascended more than 3.85% until 23rd of January 2023. The price line then stated losing bullish power and is now about to break below its bullish trend line.
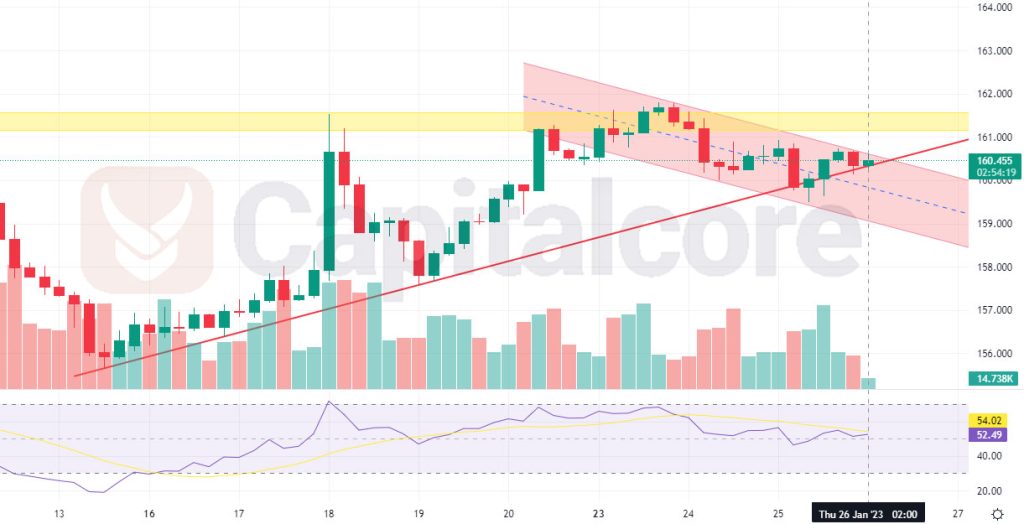
Chart Notes:
• Chart time-zone is UTC (+03:00)
• Candles’ time-frame is 4h.
The pair is now being traded at 160.455. The current location of the price line is located just below the resistance level at about 161.500 and on the bullish trend line. The mentioned static resistance level is reflected a yellow box and is of high importance, as it has already been able to dump the price line several times in the past. The red ascending line on the chart indicates the bullish trend line which supported the bullish trend on the chart. Traders could expect the price line to break below the red line and then have another retest of the yellow resistance level; there they can enter short positions and target 158.700 and 157.750 after that.
• DISCLAIMER: Please note that the above analysis is not an investment suggestion by “Capitalcore Ltd”. This post has been published only for educational purposes.