The next few candles are of high importance
GBP/JPY started a strong ascending wave on 18th of March 2020 and could ascend more than 27% until 20th of October 2021. The price then started a sideway range and formed a resistance and a support level, both of which are still valid and has not been broken to either sides. The overall look of the chart is bearish.
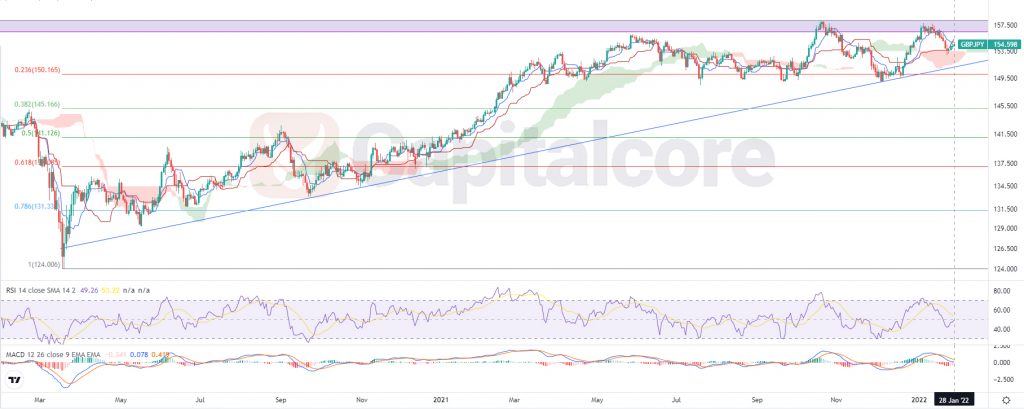
Chart Notes:
• Chart time-zone is UTC (+03:00)
• Candles’ time-frame is daily.
The price line on GBP/USD chart is showing 154.6 at the moment. There is a resistance level above the price on 156.4 – 158.3 ; the area has been shown as a purple zone on the chart. There is also a strong support level on 148.6 – 149.7. RSI is showing almost 50 and has issued a negative divergence a few weeks ago. The price line is above the ichimoku cloud and MACD is showing weakness in descending wave. There is also a dynamic trendline below the price line which is shown as a blue line on the chart. The purple resistance level looks too strong to be broken easily. Sellers can be waiting for the price line to break below the dynamic resistance, most probably after having a retest of the purple area, and then they can enter the market on the pullback on the dynamic resistance. The target for the descending wave could be considered on 150 and 145.5. Please consider that if the purple zone gets broken, buyers would have a higher chance of winning than sellers.
• DISCLAIMER: Please note that the above analysis is not an investment suggestion by “Capitalcore Ltd”. This post has been published only for educational purposes.