- December 27, 2021
- Category: Market News
The ascending channel is broken
The price line has descended sharply since 20th of October and the price experienced a free fall, more than 5.8 % descend. Then an ascending channel formed and could cover up to level 0.5 of the descent. The ascending channel now is broken and the overall look of the chart is bearish.
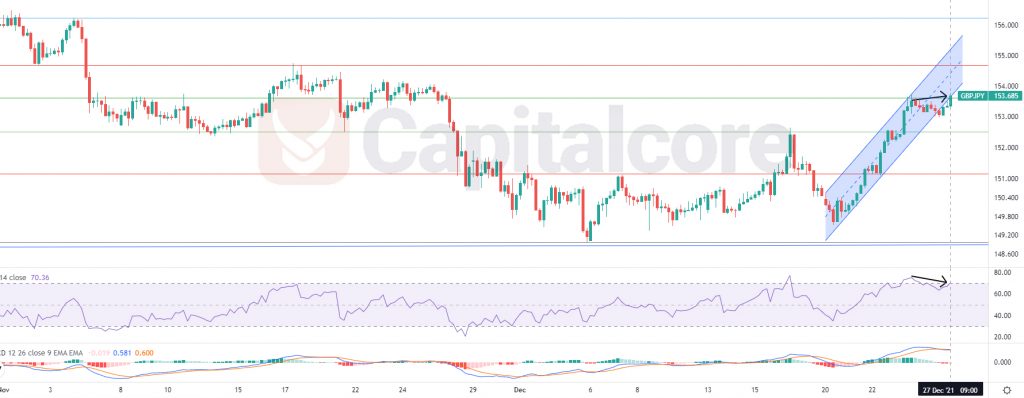
Chart Notes:
• Chart time-zone is UTC (+03:00)
• Candles’ time-frame is 4h.
The price at the moment is on 153.685, which would be just below the base line of the channel and almost on level 0.5 of the Fibonacci retracement. RSI is almost on 70 and is showing negative divergence, which is indicated by two arrows in the above picture. MACD is showing potential start of a descending wave. In case the price wont break in the channel once more, sellers can be waiting for a descending wave heading to level 0.382 of the Fibonacci, which would be around 152.515. On the other hand, in case the price line breaks into the channel again, buyers can be waiting for an ascending wave, heading to 154.69, which is less probable.
• DISCLAIMER: Please note that the above analysis is not an investment suggestion by “Capitalcore Ltd”. This post has been published only for educational purposes.