The price line is on a strong resistance
The price line started a descending wave on 20th of October and the price had a 5.8% free fall; then the price started a side way range and despite so many attempts, could not break below 148.45. The price line is on a critical moment at the moment and the next move would be of high value.
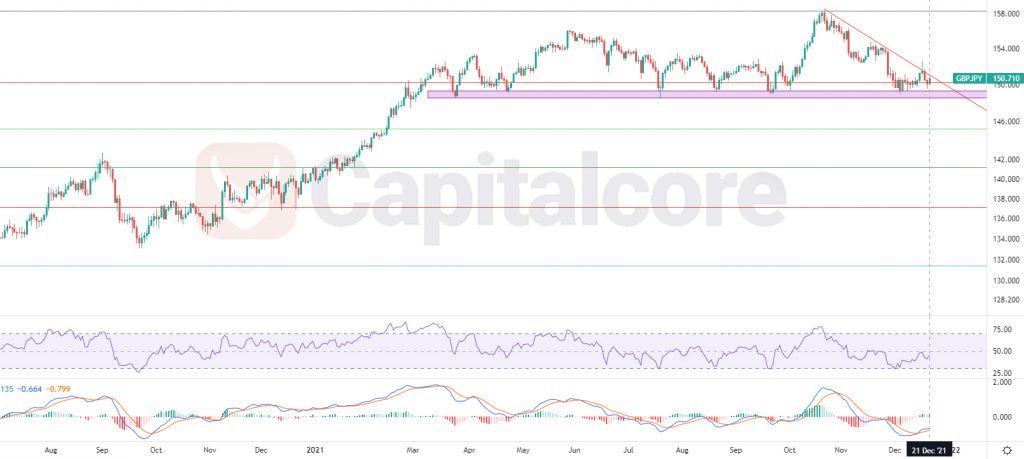
Chart Notes:
• Chart time-zone is UTC (+03:00)
• Candles’ time-frame is daily.
The price is on 150.71. The red line above the price line indicates the dynamic resistance level and the purple area below the price line shows a static resistance. RSI indicator is almost on 45 and is heading to 50 or above. MACD is showing the commencement of a new ascending phase. buyers can wait for the price line to break above the dynamic resistance level, as well as level 0.236 of the Fibonacci retracement. On the retest of the broken resistance, bulls can take the control and enter the market. The targets for the ascending wave would be 158.00 and 163.00. Please note that breaking below the support area (148.5) would highly reduce the chance of ascending.
• DISCLAIMER: Please note that the above analysis is not an investment suggestion by “Capitalcore Ltd”. This post has been published only for educational purposes.