The price is on a strong resistance
GBP/USD had a strong ascend since 17th of March. The ascending wave finished on the first of June, since then the price is moving in an ascending channel. The price right now is on the top of the channel and is expected to start descending.
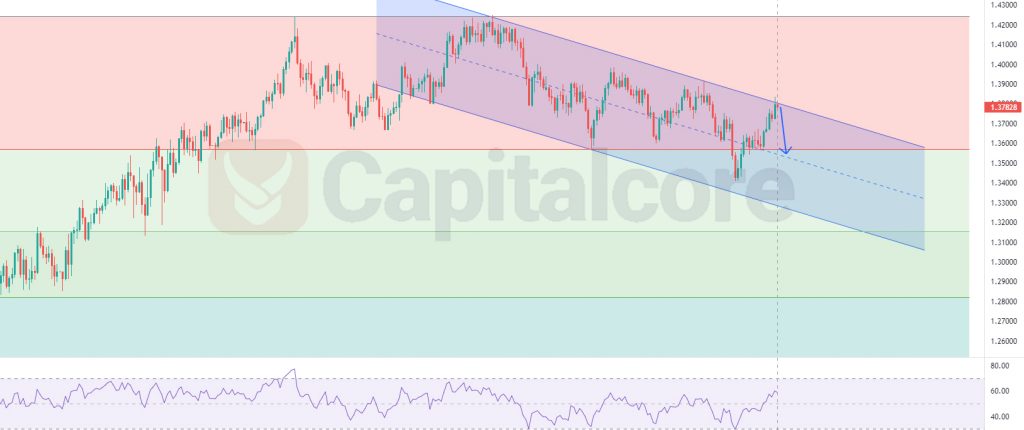
Chart Notes:
• Chart time-zone is UTC (+03:00)
• Candles’ time-frame is daily.
The price is on the top of the channel and has a difficult way to grow further. There is a strong resistance on 1.39 far apart the dynamic resistance, located at top line of the channel. In case the price can break this area, bulls can target 1.424 for the first TP and 1.44 as the next one. Sellers can target 1.35 which coordinates with the mid line of the channel and 0.236 of the Fibonacci retracement. In case the price breaks below 1.35, the next target for the wave would be 1.32.
• DISCLAIMER: Please note that the above analysis is not an investment suggestion by “Capitalcore Ltd”. This post has been published only for educational purposes.