A strong support zone is backing up the price line
After weeks of indecision in the market, GBP/NZD is now at a very important crossroads, showing absolute potential for an upside trend in the near future. Several indicators are confirming this potential and buyers are watching the charts closely for a possible hunt.
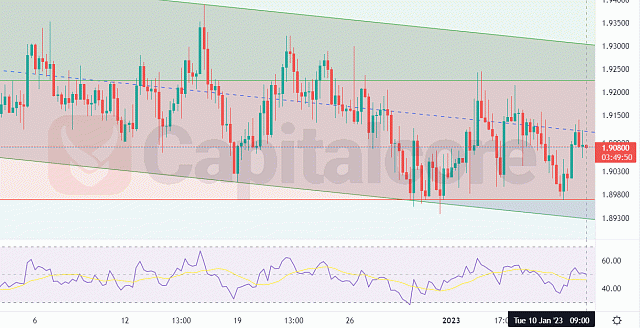
Chart Notes:
• Chart time-zone is UTC (+03:00)
• Candles’ time-frame is 4h.
The GBPNZD price line has been fluctuating in a constrained band lately. On this chart, the neutral trend resulted in the formation of a descending channel, which is shown as a dark area surrounding the price line. The colorful horizontal levels indicate different Fibonacci retracement levels and as it can be indicate, the price line is constantly making reactions to the red level which equals level 0.618 of the retracement. MACD and RSI on the chart suggest that an ascending wave may be about to form. Traders are suggested keep a close eye on the chart after a potential retest of the support zone to seek for any raising trigger. They can then take long positions from there, which will carry them to the resistance levels at 1.94500 and 1.96000.
• DISCLAIMER: Please note that the above analysis is not an investment suggestion by “Capitalcore Ltd”. This post has been published only for educational purposes.