Trend reversal signals have been issued
GBP/NZD gone through a descending wave on 15th of February 2022 and the price dumbed about 8.15% until 30th of March 2022, when a support level pumped the price smoothly, although the price line has broken below the ascending trend line, a strong ascending wave is still possible to occur.
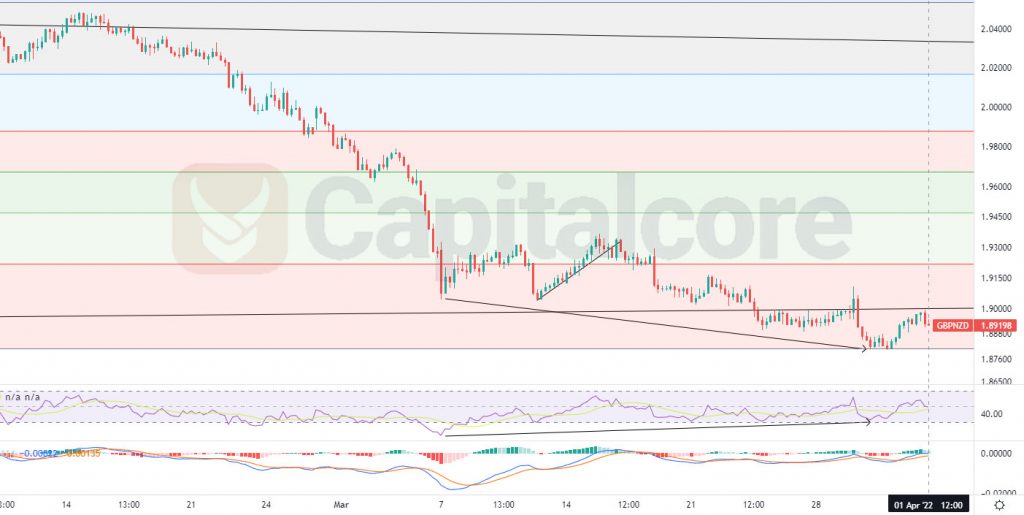
Chart Notes:
• Chart time-zone is UTC (+03:00)
• Candles’ time-frame is 4h.
The price line is on 1.89198 which would be on a support level on daily time frame. The black line on the chart indicates the ascending trend line which has been broke by the price line. RSI is almost on 50 at the moment and has issued positive divergence signals; this divergence is shown by two arrows, below RSI and price line. MACD is showing weakness in ascending trend and is also issuing negative divergence signals. Traders can be waiting for the price line to form a double low on 4h time frame, then they can enter long positions. The target for the ascending wave could be considered on 1.93 and 1.9879. Please consider that forming a a new lower low would reduce the validity of this analysis.
• DISCLAIMER: Please note that the above analysis is not an investment suggestion by “Capitalcore Ltd”. This post has been published only for educational purposes.