The price in a strong resistance area
There are no major economic reports in the UK today. On the chart, GBP/USD is in a calm area after a sharp ascend. The area is surrounded by strong support and resistance levels. GBP/USD price line is not any clear but or sell signals. The area should be broken to either sides to reveal the next move.
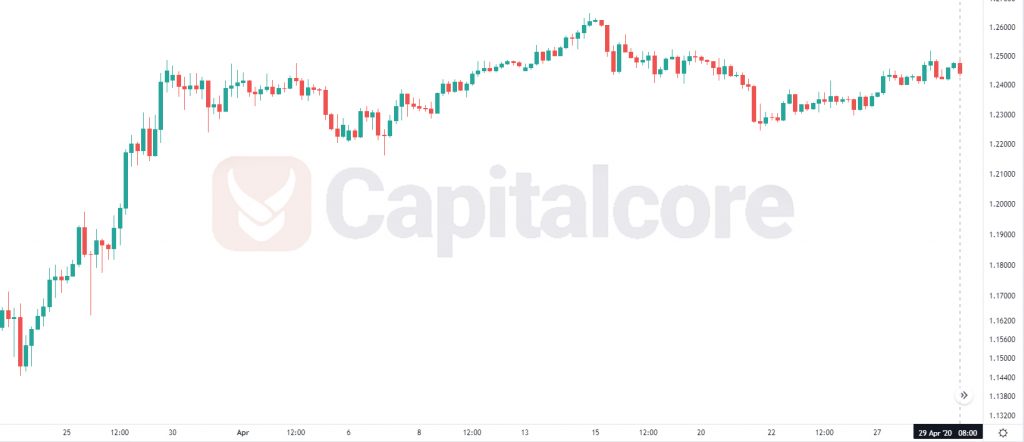
Chart Notes:
• Chart time-zone is UTC (+03:00)
• Candles’ time-frame is 4h.
The support rests at 1.24390 with resistance at 1.25050 which both lines are above the weekly pivot point at 1.23730. The EMA of 10 is moving with bullish bias in the ascendant channel and it is above the EMA of 200 and the EMA of 100. The RSI is moving above 50 level, the Stochastic is showing upward momentum and the MACD line is on the signal line in the positive territory. The ADX is showing buy signal.
The resistance line breakout will push the price up towards the previous high at 1.26460; otherwise, GBPUSD will be fluctuating within the colored area.
• DISCLAIMER: Please note that the above analysis is not an investment suggestion by “Capitalcore Ltd”. This post has been published only for educational purposes.