A trend reversal seems to be close
PMI Manufacturing will be published in the UK but it is not going to influence GBPUSD much. On the chart the price line, after a bullish step looks to be getting ready for a descend. Different indicators are issuing trend reversal signal and the price expected to decline.
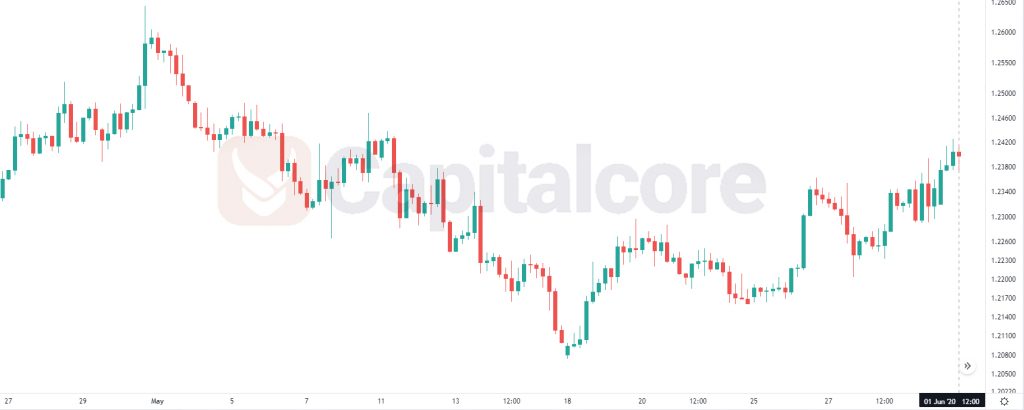
Chart Notes:
• Chart time-zone is UTC (+03:00)
• Candles’ time-frame is 4h.
The support rests at 1.23250 with resistance at 1.24480 which both lines are above the weekly pivot point at 1.23030. The EMA of 10 is moving with bullish bias in the ascendant channel and it is above the EMA of 200 and the EMA of 100. The RSI is rising towards overbought area, the Stochastic is showing upward momentum and the MACD line is above the signal line in the positive territory. The ADX is showing buy signal.
The price is growing towards level 61.8 of Fibonacci to complete the correction pattern but the resistance line seems to be too strong to be broken. Bears are waiting for a chance to take over the chart.
• DISCLAIMER: Please note that the above analysis is not an investment suggestion by “Capitalcore Ltd”. This post has been published only for educational purposes.