- October 1, 2021
- Category: Market News
Powerful Bearish channel is formed
USD continues getting more powerful day by day. GBP/USD started an ascending wave a few months ago; but had not been able to break below 1.36. On 28th of September the price could finally break out of this support level and now the overall look of the chart is bearish.
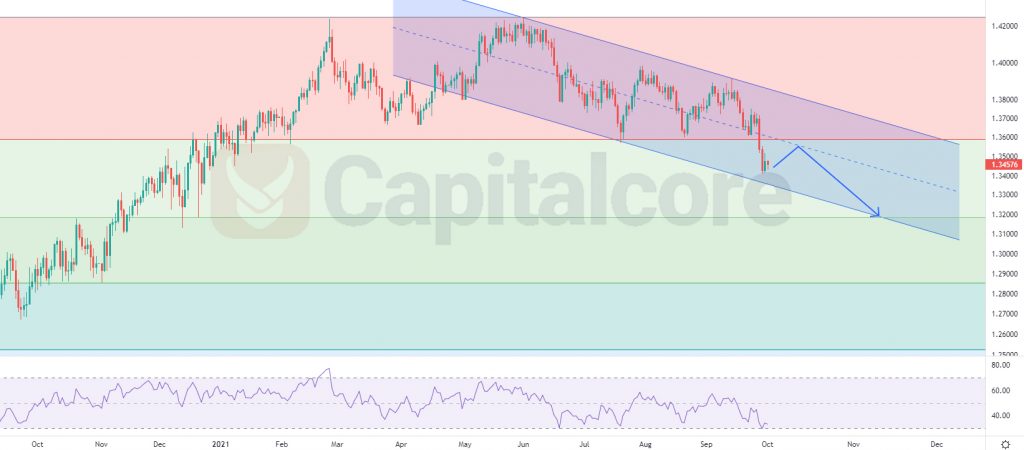
Chart Notes:
• Chart time-zone is UTC (+03:00)
• Candles’ time-frame is daily.
The strong support at 1.36, which is level 0.236 of the Fibonacci retracement, was broken at 28th of September and is possible to act as a resistance at the next encounter with the price line. The price is moving in a bearish channel since the beginning of June. RSI is indicating strong ascend and also is MACD. As we expect the price is going to be strongly descending in the next few days, after a possible pull back to the resistance at 1.36. Bears can be expecting to see the price line at bout 1.32. The other possible move of the price would be cutting back above 0.236 of the Fibonacci retracement. In this case the next move of the chart is supposed to be bullish. bulls can target 1.4 in case this scenario is triggered.
• DISCLAIMER: Please note that the above analysis is not an investment suggestion by “Capitalcore Ltd”. This post has been published only for educational purposes.