- October 2, 2024
- Posted By: mia
- Category: Market News
GBP/USD Forecast: Downside Risk as Channel Breaks
The GBP/USD pair, commonly known as “Cable,” is one of the most traded forex pairs in the global currency market, representing the British Pound and the US Dollar. Traders focus on key economic data from both countries, as the pair reacts strongly to macroeconomic indicators, central bank actions, and geopolitical developments. This currency pair’s movement is often influenced by the monetary policies of the Federal Reserve (Fed) and the Bank of England (BoE), making it sensitive to both economic news and interest rate decisions. The GBP/USD fundamental outlook today will as always be highly impacted by today’s key releases from the US, including the ADP employment report, which gives early insights into job creation before the official US government data. A stronger ADP report would favor the US Dollar, leading to potential bearish pressure on the GBP/USD trading environment. Additionally, speeches by various Federal Reserve members, such as those from the Cleveland and St. Louis branches, could shed light on future interest rate policies. Any hawkish commentary would strengthen the dollar, putting further downward pressure on the pair. For the GBP side, the market will closely watch the BoE’s recent stress test results to gauge financial stability, which could affect the pair’s volatility. 
Chart Notes:
• Chart time-zone is UTC (+03:00)
• Candles’ time-frame is 4h.
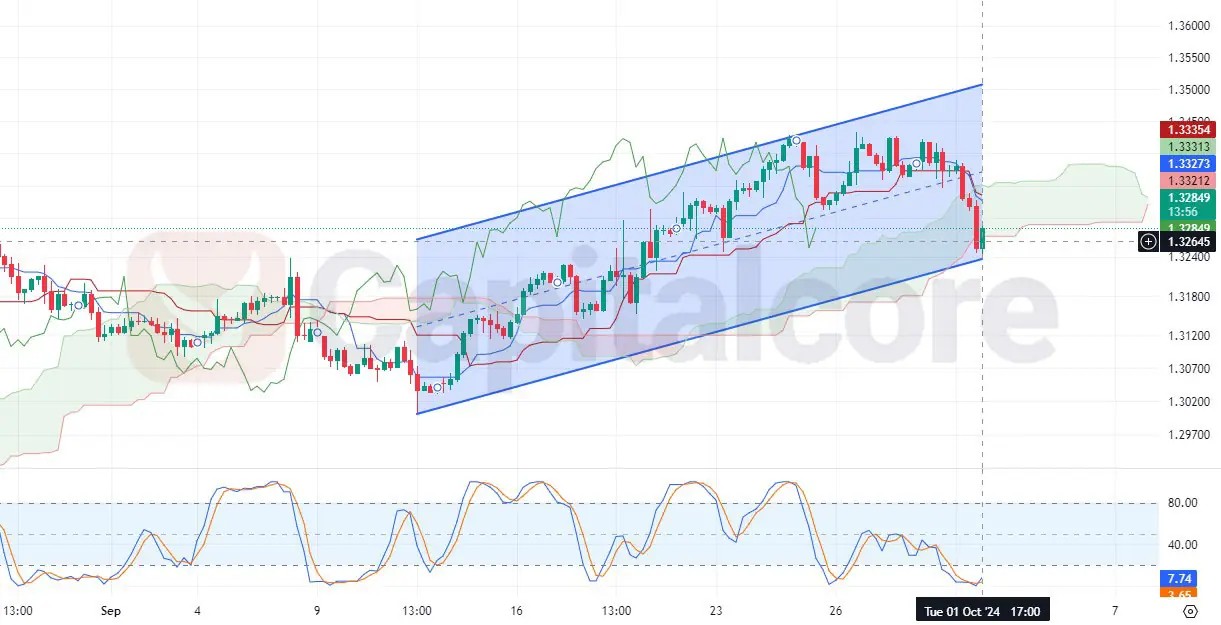
Looking at the GBP/USD H4 chart, the price has been moving in a channel, but its recent price action shows a break of the channel’s lower boundary. The last five candles reflect a transition from a bullish momentum (green candles) to a bearish reversal (red candles). the Ichimoku cloud (Kumo) is showing signs of potential GBPUSD bearish pressure. The price has broken below the upward channel and is now testing the lower boundary of the cloud, indicating a shift in momentum. The cloud itself is relatively thin, suggesting that the current support level is weak. The stochastic oscillator shows oversold conditions, suggesting that although there is bearish momentum, a corrective pullback might be expected soon. Further downside could see the pair targeting support levels near the 1.3200 area.
•DISCLAIMER: Please note that the above analysis is not an investment suggestion by “Capitalcore LLC”. This post has been published only for educational purposes.